29
/
en
AIzaSyAYiBZKx7MnpbEhh9jyipgxe19OcubqV5w
April 1, 2024
34167
Fragile and conflict affected situations
FCS
false
2
1
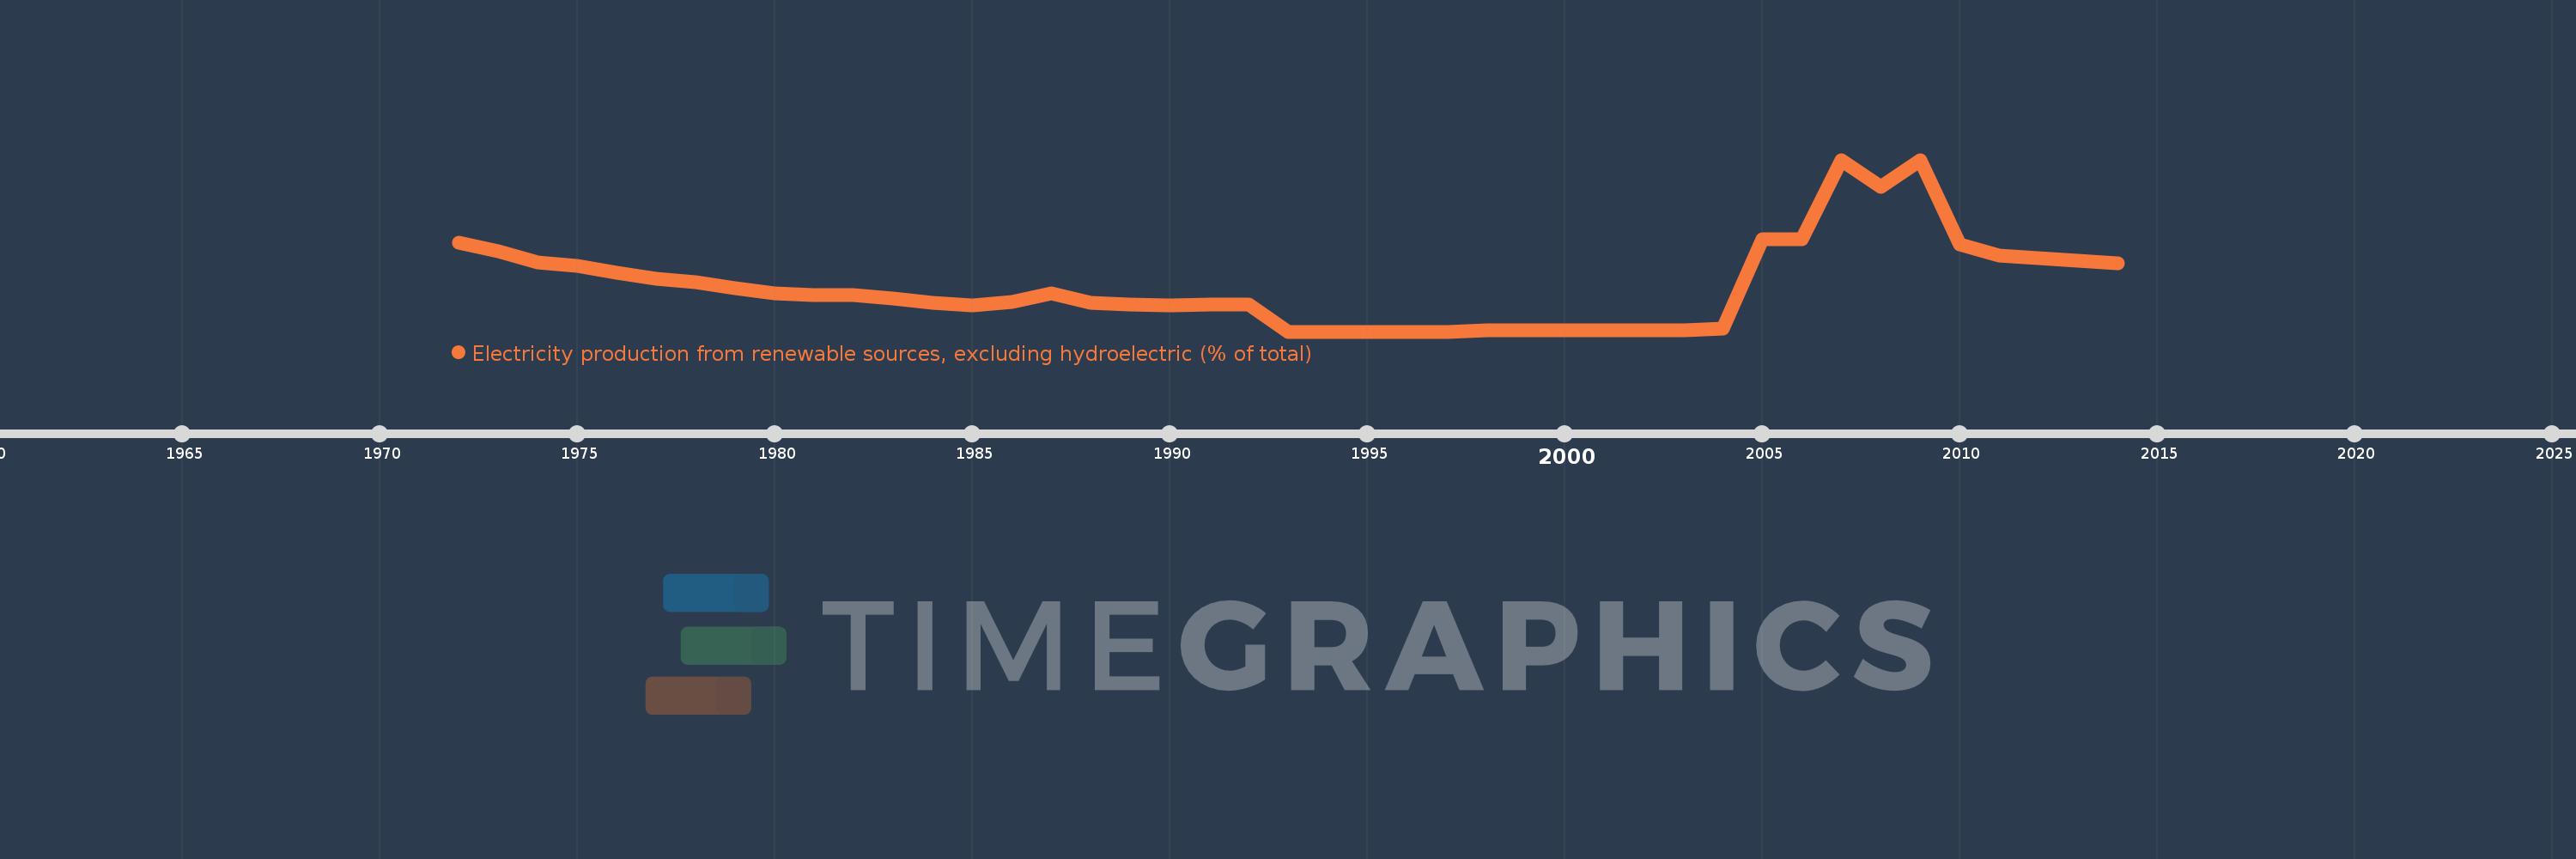
Electricity production from renewable sources, excluding hydroelectric (% of total)
2014,2013,2012,2011,2010,2009,2008,2007,2006,2005,2004,2003,2002,2001,2000,1999,1998,1997,1996,1995,1994,1993,1992,1991,1990,1989,1988,1987,1986,1985,1984,1983,1982,1981,1980,1979,1978,1977,1976,1975,1974,1973,1972
This statistics in other country:
AlbaniaAlgeriaAngolaArab WorldArgentinaArmeniaAustraliaAustriaAzerbaijanBahrainBangladeshBelarusBelgiumBeninBoliviaBosnia and HerzegovinaBotswanaBrazilBrunei DarussalamBulgariaCambodiaCameroonCanadaCentral Europe and the BalticsChileChinaColombiaCongo, Dem. Rep.Congo, Rep.Costa RicaCote d'IvoireCroatiaCubaCuracaoCyprusCzech RepublicDenmarkDominican RepublicEarly-demographic dividendEast Asia & PacificEast Asia & Pacific (excluding high income)East Asia & Pacific (IDA & IBRD countries)EcuadorEgypt, Arab Rep.El SalvadorEritreaEstoniaEthiopiaEuro areaEurope & Central AsiaEurope & Central Asia (excluding high income)Europe & Central Asia (IDA & IBRD countries)European UnionFinlandFragile and conflict affected situationsFranceGabonGeorgiaGermanyGhanaGibraltarGreeceGuatemalaHaitiHeavily indebted poor countries (HIPC)High incomeHondurasHong Kong SAR, ChinaHungaryIBRD onlyIcelandIDA & IBRD totalIDA blendIDA onlyIDA totalIndiaIndonesiaIran, Islamic Rep.IraqIrelandIsraelItalyJamaicaJapanJordanKazakhstanKenyaKorea, Dem. People’s Rep.Korea, Rep.KosovoKuwaitKyrgyz RepublicLate-demographic dividendLatin America & Caribbean Latin America & Caribbean (excluding high income)Latin America & the Caribbean (IDA & IBRD countries)LatviaLeast developed countries: UN classificationLebanonLibyaLithuaniaLow & middle incomeLower middle incomeLuxembourgMacedonia, FYRMalaysiaMaltaMauritiusMexicoMiddle East & North AfricaMiddle East & North Africa (excluding high income)Middle East & North Africa (IDA & IBRD countries)Middle incomeMoldovaMongoliaMontenegroMoroccoMozambiqueMyanmarNamibiaNepalNetherlandsNew ZealandNicaraguaNigerNigeriaNorth AmericaNorwayOECD membersOmanOther small statesPakistanPanamaParaguayPeruPhilippinesPolandPortugalPost-demographic dividendPre-demographic dividendQatarRomaniaRussian FederationSaudi ArabiaSenegalSerbiaSingaporeSlovak RepublicSloveniaSmall statesSouth AfricaSouth AsiaSouth Asia (IDA & IBRD)South SudanSpainSri LankaSub-Saharan Africa Sub-Saharan Africa (excluding high income)Sub-Saharan Africa (IDA & IBRD countries)SudanSwedenSwitzerlandSyrian Arab RepublicTajikistanTanzaniaThailandTogoTrinidad and TobagoTunisiaTurkeyTurkmenistanUkraineUnited Arab EmiratesUnited KingdomUnited StatesUpper middle incomeUruguayUzbekistanVenezuela, RBVietnamWorldYemen, Rep.ZambiaZimbabwe Timeline:
This timeline shows a graph from 1972 to 2014 of Fragile and conflict affected situations. No data until 1971. Number of actual observations by date: 43.
Source name:
World Development Indicators
Source organization:
IEA Statistics © OECD/IEA 2014 (http://www.iea.org/stats/index.asp), subject to https://www.iea.org/t&c/termsandconditions/
Categories, topics:
Energy & Mining, Climate Change, Environment
Last updated:
apr 23, 2017
Indicators value changes by year
At the date of observation
Value
Absolute change
Change from previous value
jan 1, 1972
0.065
+0.065
0.0%
jan 1, 1973
0.059
-0.006
-8.92%
jan 1, 1974
0.051
-0.008
-13.58%
jan 1, 1975
0.048
-0.003
-5.46%
jan 1, 1976
0.043
-0.005
-11.06%
jan 1, 1977
0.039
-0.004
-9.64%
jan 1, 1978
0.036
-0.003
-8.55%
jan 1, 1979
0.032
-0.003
-9.4%
jan 1, 1980
0.028
-0.004
-13.67%
jan 1, 1981
0.027
-0.001
-2.22%
jan 1, 1982
0.027
0.0
-1.76%
jan 1, 1983
0.024
-0.003
-11.9%
jan 1, 1984
0.021
-0.002
-10.51%
jan 1, 1985
0.019
-0.002
-8.43%
jan 1, 1986
0.022
+0.003
15.08%
jan 1, 1987
0.028
+0.006
27.47%
jan 1, 1988
0.021
-0.007
-24.08%
jan 1, 1989
0.02
-0.001
-6.6%
jan 1, 1990
0.019
-0.001
-2.93%
jan 1, 1991
0.02
+0.001
3.0%
jan 1, 1992
0.02
+0.0
1.66%
jan 1, 1993
0.0
-0.02
-100.0%
jan 1, 1998
0.001
+0.001
%
jan 1, 1999
0.001
0.0
-3.46%
jan 1, 2000
0.001
0.0
-5.63%
jan 1, 2001
0.001
0.0
-4.27%
jan 1, 2002
0.001
+0.001
92.11%
jan 1, 2003
0.001
0.0
-6.15%
jan 1, 2004
0.002
+0.001
50.83%
jan 1, 2005
0.068
+0.066
3.28K%
jan 1, 2006
0.068
-0.001
-0.9%
jan 1, 2007
0.126
+0.058
85.31%
jan 1, 2008
0.106
-0.02
-16.07%
jan 1, 2009
0.126
+0.02
19.35%
jan 1, 2010
0.064
-0.062
-49.21%
jan 1, 2011
0.056
-0.008
-11.98%
jan 1, 2012
0.054
-0.002
-3.97%
jan 1, 2013
0.052
-0.002
-3.35%
jan 1, 2014
0.05
-0.002
-4.14%
Ranking of countries by current statistics by years


Comments: