29
/
en
AIzaSyAYiBZKx7MnpbEhh9jyipgxe19OcubqV5w
April 1, 2024
155865
Indonesia
IDN
true
2
1
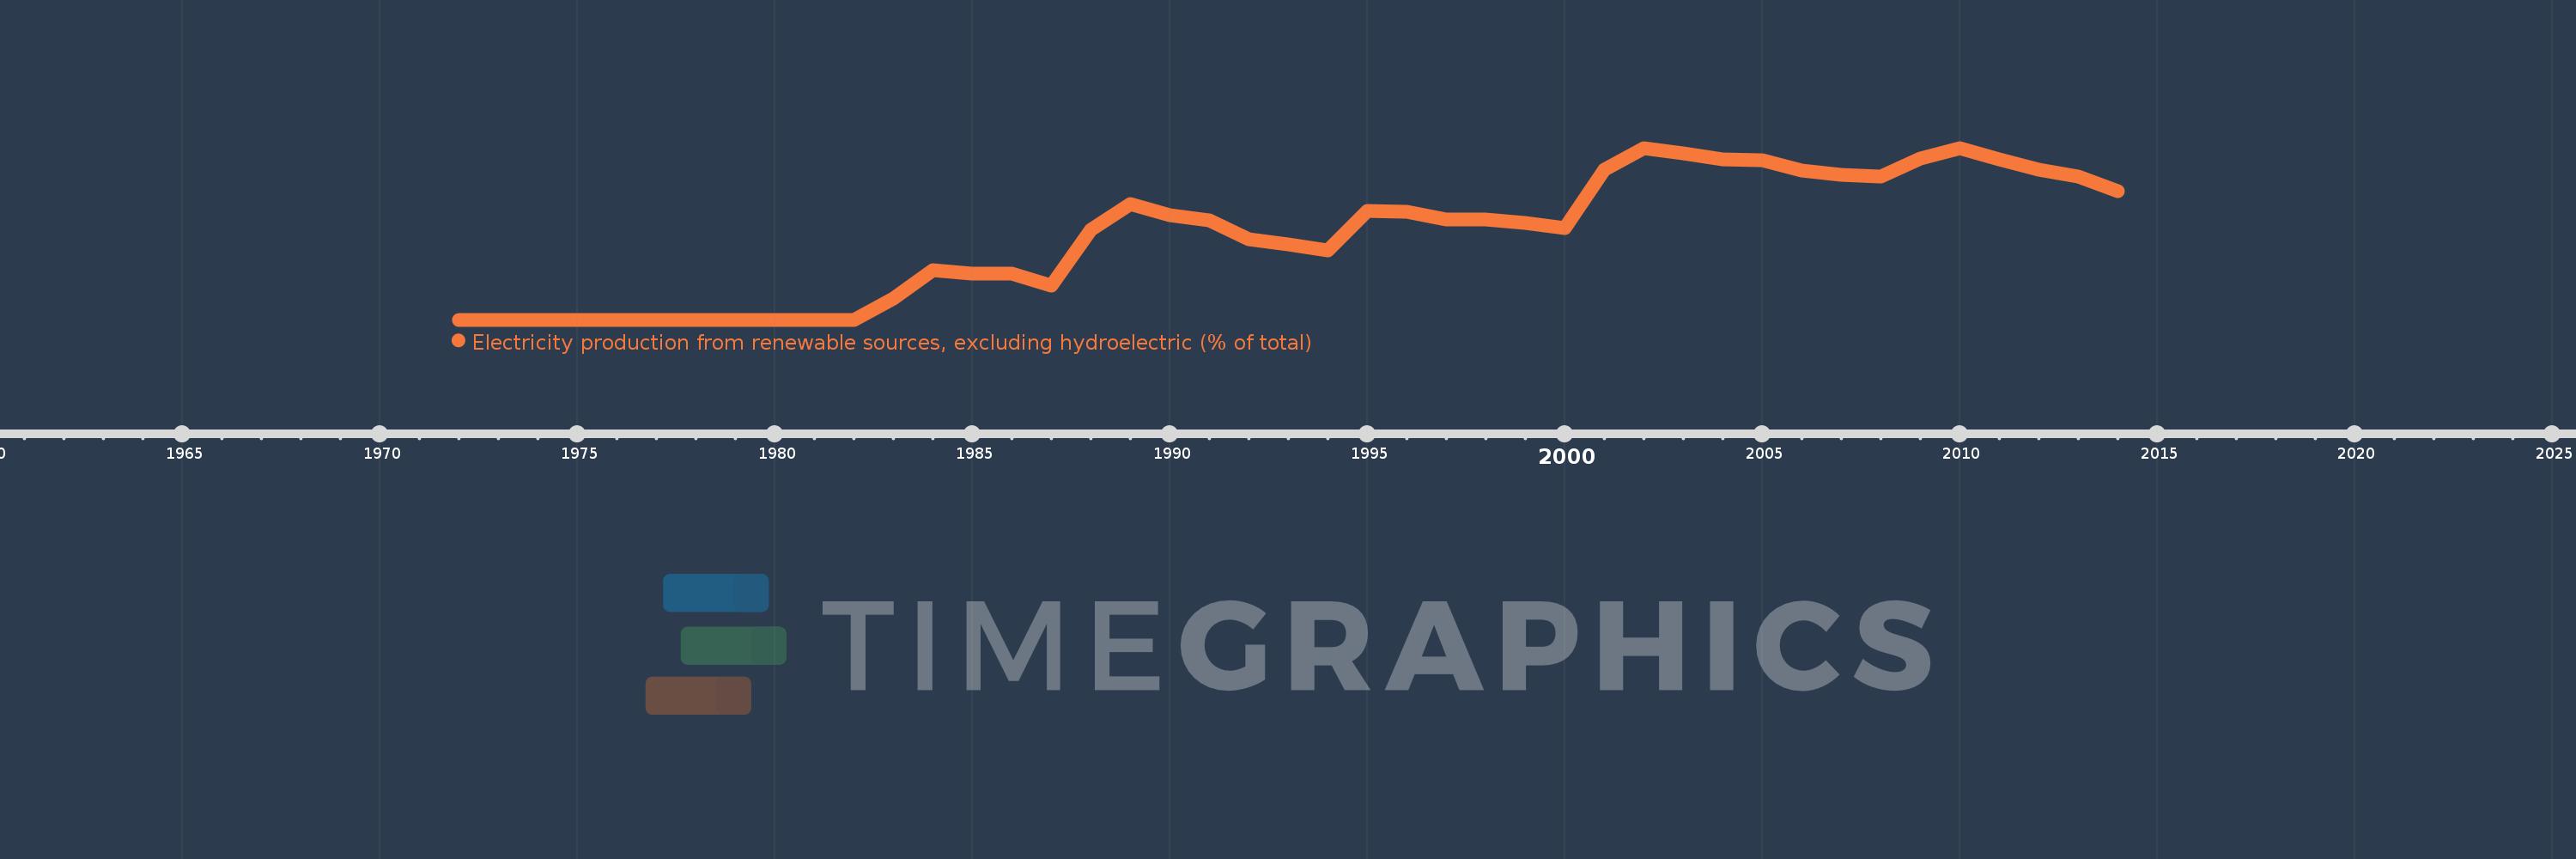
Electricity production from renewable sources, excluding hydroelectric (% of total)
2014,2013,2012,2011,2010,2009,2008,2007,2006,2005,2004,2003,2002,2001,2000,1999,1998,1997,1996,1995,1994,1993,1992,1991,1990,1989,1988,1987,1986,1985,1984,1983,1982,1981,1980,1979,1978,1977,1976,1975,1974,1973,1972
This statistics in other country:
AlbaniaAlgeriaAngolaArab WorldArgentinaArmeniaAustraliaAustriaAzerbaijanBahrainBangladeshBelarusBelgiumBeninBoliviaBosnia and HerzegovinaBotswanaBrazilBrunei DarussalamBulgariaCambodiaCameroonCanadaCentral Europe and the BalticsChileChinaColombiaCongo, Dem. Rep.Congo, Rep.Costa RicaCote d'IvoireCroatiaCubaCuracaoCyprusCzech RepublicDenmarkDominican RepublicEarly-demographic dividendEast Asia & PacificEast Asia & Pacific (excluding high income)East Asia & Pacific (IDA & IBRD countries)EcuadorEgypt, Arab Rep.El SalvadorEritreaEstoniaEthiopiaEuro areaEurope & Central AsiaEurope & Central Asia (excluding high income)Europe & Central Asia (IDA & IBRD countries)European UnionFinlandFragile and conflict affected situationsFranceGabonGeorgiaGermanyGhanaGibraltarGreeceGuatemalaHaitiHeavily indebted poor countries (HIPC)High incomeHondurasHong Kong SAR, ChinaHungaryIBRD onlyIcelandIDA & IBRD totalIDA blendIDA onlyIDA totalIndiaIndonesiaIran, Islamic Rep.IraqIrelandIsraelItalyJamaicaJapanJordanKazakhstanKenyaKorea, Dem. People’s Rep.Korea, Rep.KosovoKuwaitKyrgyz RepublicLate-demographic dividendLatin America & Caribbean Latin America & Caribbean (excluding high income)Latin America & the Caribbean (IDA & IBRD countries)LatviaLeast developed countries: UN classificationLebanonLibyaLithuaniaLow & middle incomeLower middle incomeLuxembourgMacedonia, FYRMalaysiaMaltaMauritiusMexicoMiddle East & North AfricaMiddle East & North Africa (excluding high income)Middle East & North Africa (IDA & IBRD countries)Middle incomeMoldovaMongoliaMontenegroMoroccoMozambiqueMyanmarNamibiaNepalNetherlandsNew ZealandNicaraguaNigerNigeriaNorth AmericaNorwayOECD membersOmanOther small statesPakistanPanamaParaguayPeruPhilippinesPolandPortugalPost-demographic dividendPre-demographic dividendQatarRomaniaRussian FederationSaudi ArabiaSenegalSerbiaSingaporeSlovak RepublicSloveniaSmall statesSouth AfricaSouth AsiaSouth Asia (IDA & IBRD)South SudanSpainSri LankaSub-Saharan Africa Sub-Saharan Africa (excluding high income)Sub-Saharan Africa (IDA & IBRD countries)SudanSwedenSwitzerlandSyrian Arab RepublicTajikistanTanzaniaThailandTogoTrinidad and TobagoTunisiaTurkeyTurkmenistanUkraineUnited Arab EmiratesUnited KingdomUnited StatesUpper middle incomeUruguayUzbekistanVenezuela, RBVietnamWorldYemen, Rep.ZambiaZimbabwe Timeline:
This timeline shows a graph from 1972 to 2014 of Indonesia. No data until 1971. Number of actual observations by date: 43.
Source name:
World Development Indicators
Source organization:
IEA Statistics © OECD/IEA 2014 (http://www.iea.org/stats/index.asp), subject to https://www.iea.org/t&c/termsandconditions/
Categories, topics:
Energy & Mining, Climate Change, Environment
Last updated:
apr 23, 2017
Indicators value changes by year
At the date of observation
Value
Absolute change
Change from previous value
jan 1, 1983
0.738
+0.738
%
jan 1, 1984
1.726
+0.988
133.92%
jan 1, 1985
1.593
-0.133
-7.7%
jan 1, 1986
1.589
-0.004
-0.26%
jan 1, 1987
1.189
-0.4
-25.15%
jan 1, 1988
3.129
+1.94
163.13%
jan 1, 1989
4.016
+0.886
28.32%
jan 1, 1990
3.633
-0.382
-9.52%
jan 1, 1991
3.444
-0.189
-5.21%
jan 1, 1992
2.809
-0.635
-18.42%
jan 1, 1993
2.611
-0.198
-7.05%
jan 1, 1994
2.41
-0.202
-7.72%
jan 1, 1995
3.775
+1.366
56.68%
jan 1, 1996
3.742
-0.033
-0.89%
jan 1, 1997
3.48
-0.262
-6.99%
jan 1, 1998
3.497
+0.017
0.49%
jan 1, 1999
3.36
-0.137
-3.93%
jan 1, 2000
3.181
-0.179
-5.32%
jan 1, 2001
5.224
+2.043
64.21%
jan 1, 2002
5.964
+0.741
14.18%
jan 1, 2003
5.775
-0.19
-3.18%
jan 1, 2004
5.584
-0.19
-3.29%
jan 1, 2005
5.556
-0.029
-0.51%
jan 1, 2006
5.196
-0.36
-6.48%
jan 1, 2007
5.027
-0.168
-3.24%
jan 1, 2008
4.964
-0.063
-1.25%
jan 1, 2009
5.596
+0.631
12.72%
jan 1, 2010
5.972
+0.376
6.72%
jan 1, 2011
5.57
-0.402
-6.73%
jan 1, 2012
5.215
-0.355
-6.38%
jan 1, 2013
4.968
-0.246
-4.72%
jan 1, 2014
4.484
-0.484
-9.74%
Ranking of countries by current statistics by years


Comments: