29
/
en
AIzaSyAYiBZKx7MnpbEhh9jyipgxe19OcubqV5w
April 1, 2024
43757
Latin America & the Caribbean (IDA & IBRD countries)
TLA
false
2
1
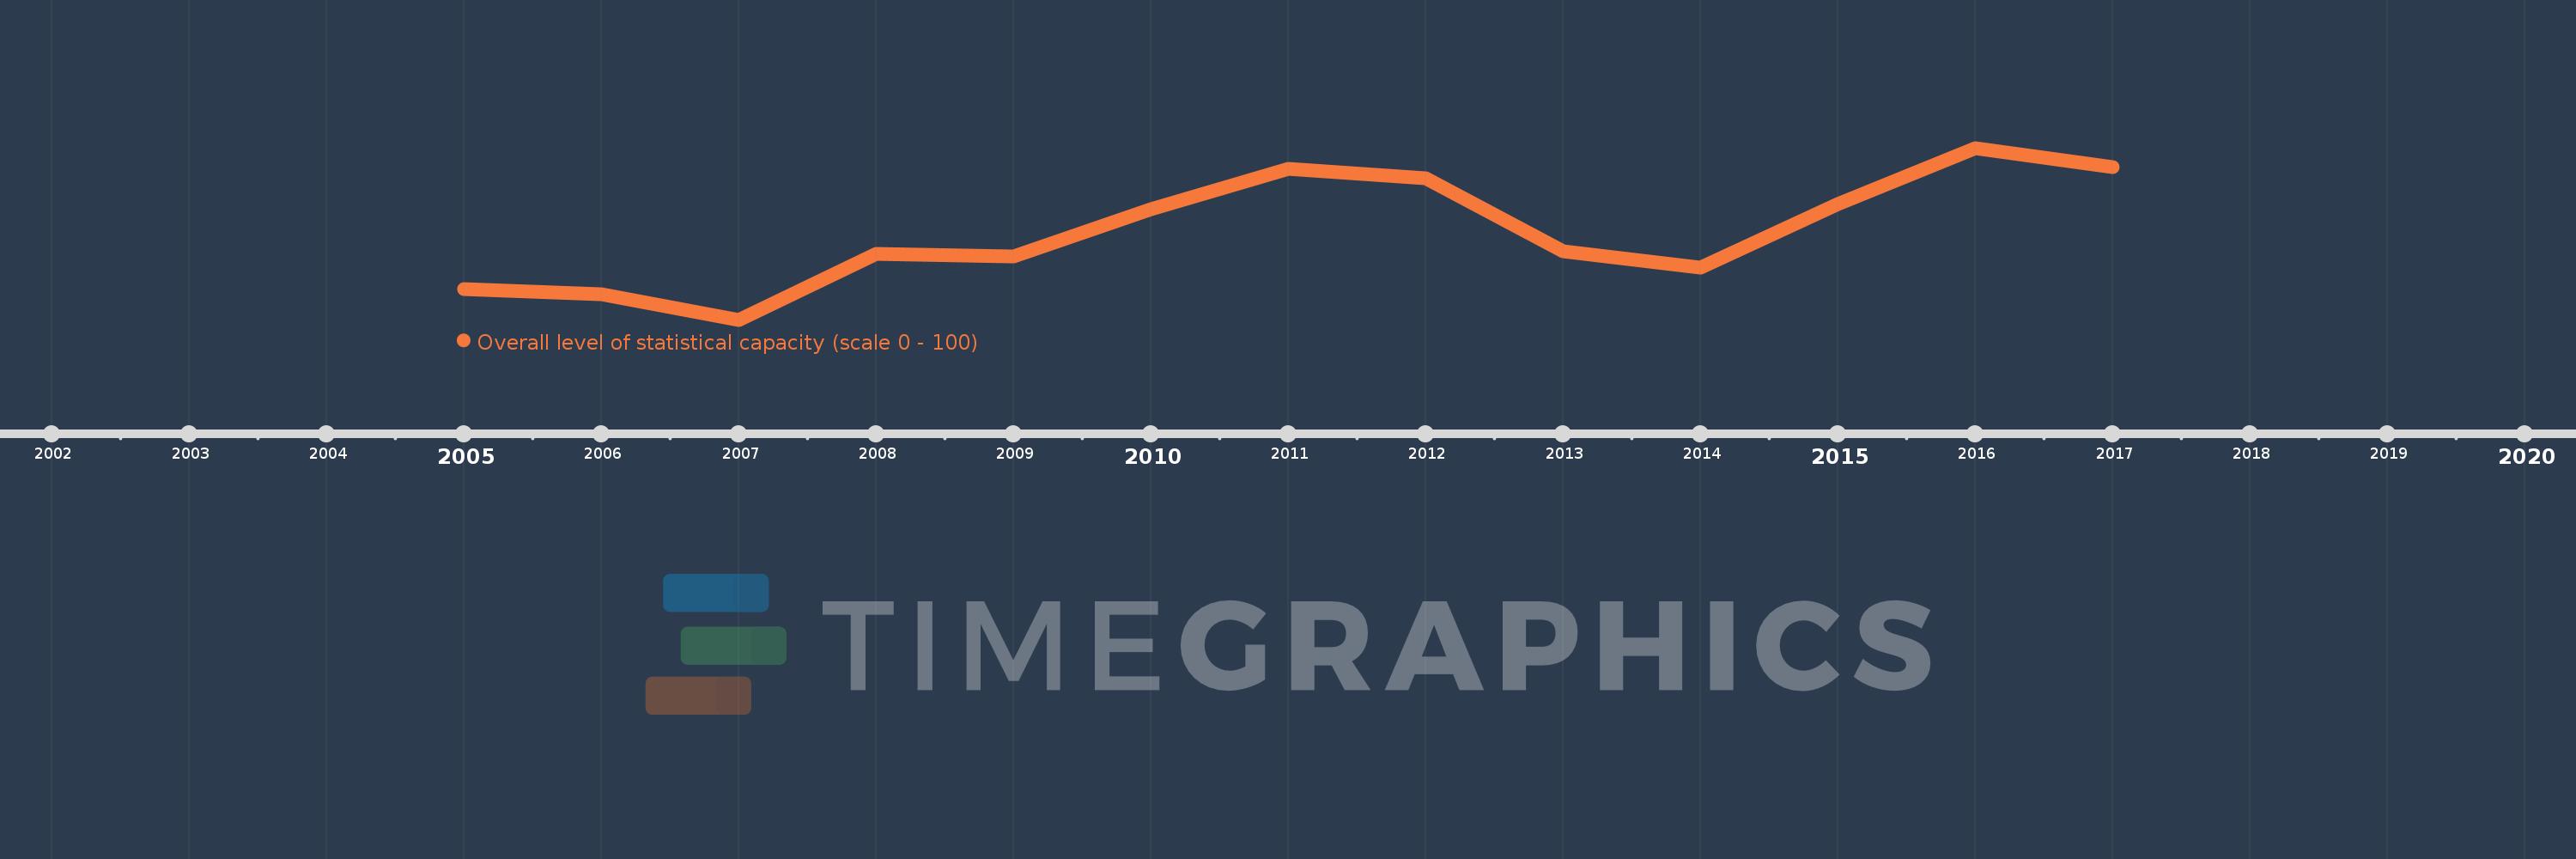
Overall level of statistical capacity (scale 0 - 100)
2017,2016,2015,2014,2013,2012,2011,2010,2009,2008,2007,2006,2005
This statistics in other country:
Timeline:
This timeline shows a graph from 2005 to 2017 of Latin America & the Caribbean (IDA & IBRD countries). No data until 2004. Number of actual observations by date: 13.
Source name:
World Development Indicators
Source organization:
World Bank
Categories, topics:
Public Sector
Last updated:
apr 23, 2017
Indicators value changes by year
Minimum:
75.291
jan 1, 2007
Maximum:
79.153
jan 1, 2016
At the date of observation
Value
Absolute change
Change from previous value
jan 1, 2005
75.979
+75.979
0.0%
jan 1, 2006
75.873
-0.106
-0.14%
jan 1, 2007
75.291
-0.582
-0.77%
jan 1, 2008
76.772
+1.481
1.97%
jan 1, 2009
76.72
-0.053
-0.07%
jan 1, 2010
77.778
+1.058
1.38%
jan 1, 2011
78.677
+0.899
1.16%
jan 1, 2012
78.466
-0.212
-0.27%
jan 1, 2013
76.825
-1.64
-2.09%
jan 1, 2014
76.455
-0.37
-0.48%
jan 1, 2015
77.884
+1.429
1.87%
jan 1, 2016
79.153
+1.27
1.63%
jan 1, 2017
78.73
-0.423
-0.53%
Ranking of countries by current statistics by years


Comments: