29
/
en
AIzaSyAYiBZKx7MnpbEhh9jyipgxe19OcubqV5w
April 1, 2024
31970
Europe & Central Asia (excluding high income)
ECA
false
2
1
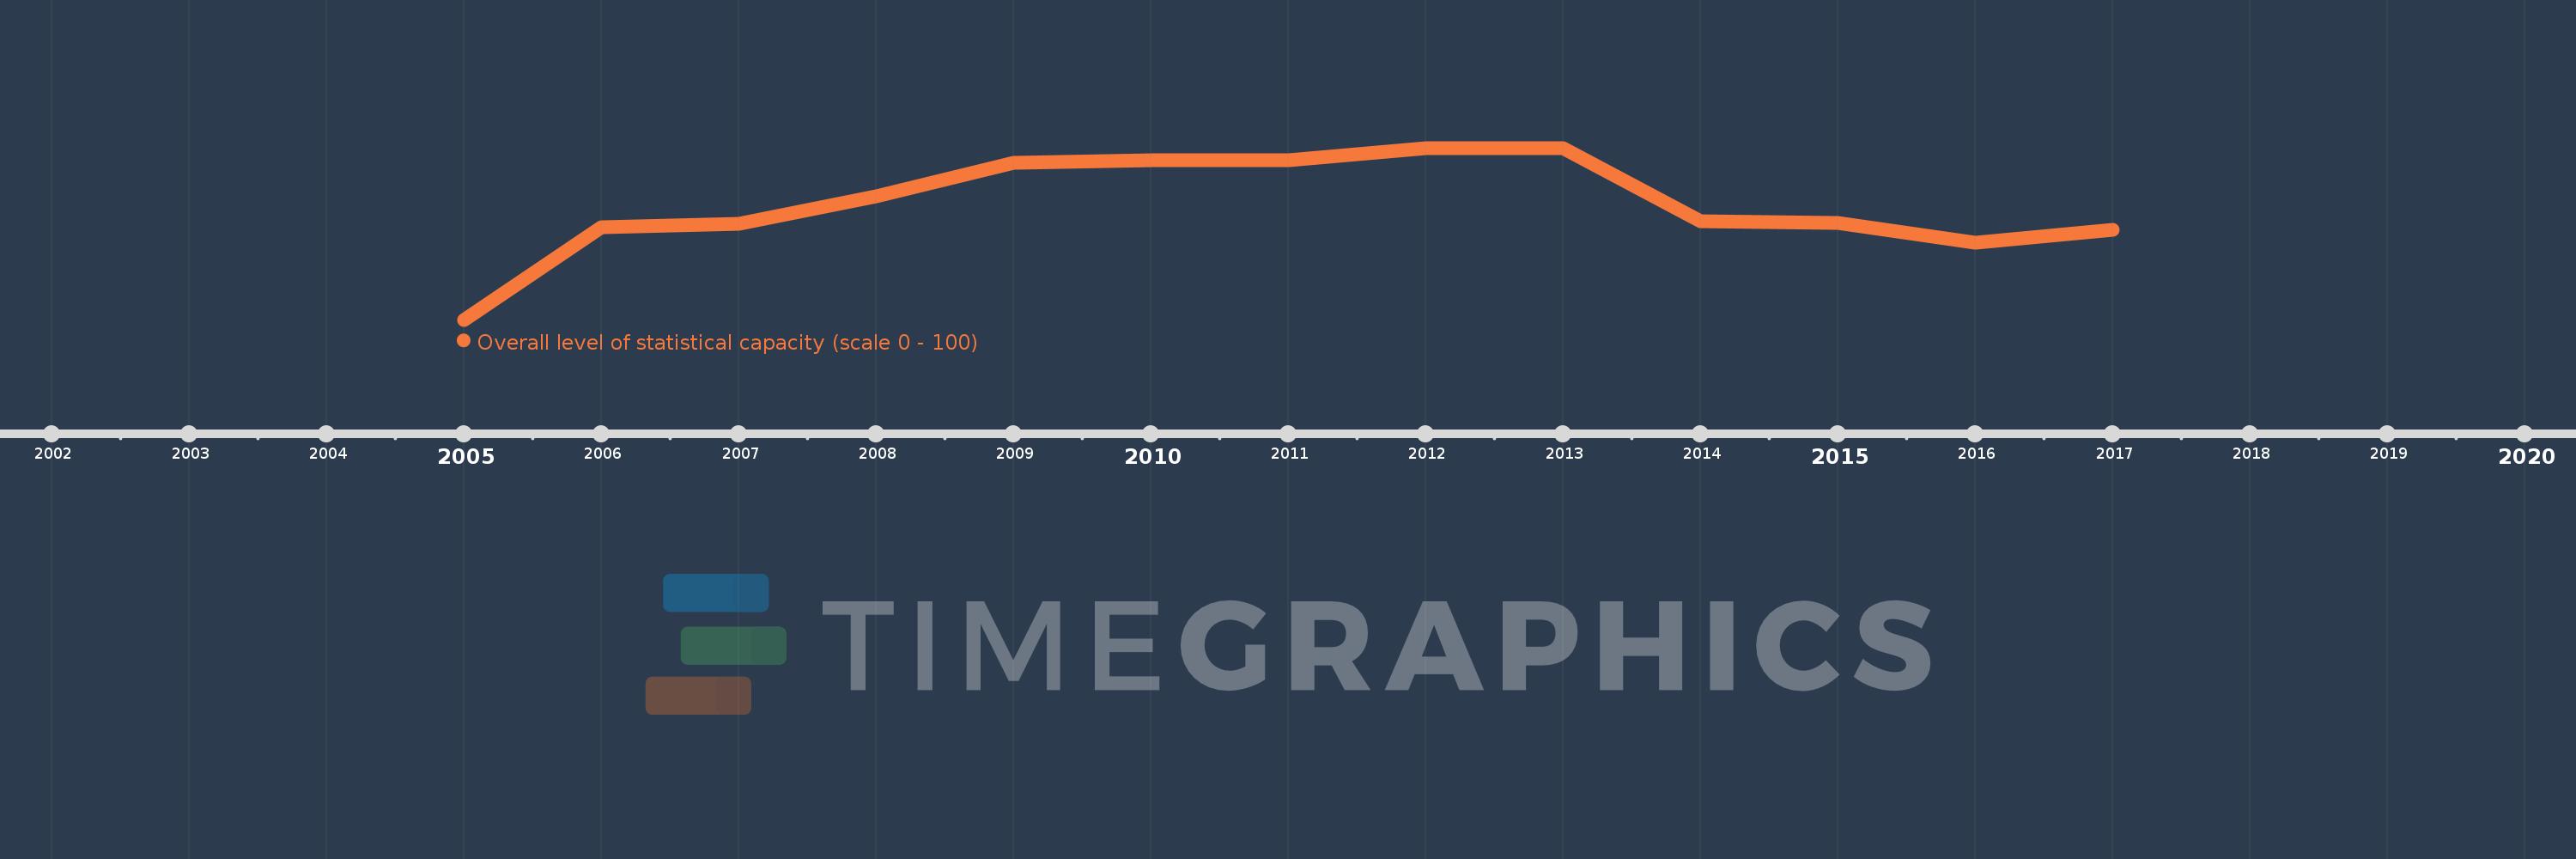
Overall level of statistical capacity (scale 0 - 100)
2017,2016,2015,2014,2013,2012,2011,2010,2009,2008,2007,2006,2005
This statistics in other country:
Timeline:
This timeline shows a graph from 2005 to 2017 of Europe & Central Asia (excluding high income). No data until 2004. Number of actual observations by date: 13.
Source name:
World Development Indicators
Source organization:
World Bank
Categories, topics:
Public Sector
Last updated:
apr 23, 2017
Indicators value changes by year
Minimum:
74.327
jan 1, 2005
Maximum:
80.936
jan 1, 2012
At the date of observation
Value
Absolute change
Change from previous value
jan 1, 2005
74.327
+74.327
0.0%
jan 1, 2006
77.895
+3.567
4.8%
jan 1, 2007
78.012
+0.117
0.15%
jan 1, 2008
79.064
+1.053
1.35%
jan 1, 2009
80.351
+1.287
1.63%
jan 1, 2010
80.468
+0.117
0.15%
jan 1, 2011
80.468
+0.0
0.0%
jan 1, 2012
80.936
+0.468
0.58%
jan 1, 2013
80.936
0.0
0.0%
jan 1, 2014
78.111
-2.825
-3.49%
jan 1, 2015
78.061
-0.05
-0.06%
jan 1, 2016
77.278
-0.783
-1.0%
jan 1, 2017
77.778
+0.5
0.65%
Ranking of countries by current statistics by years


Comments: