29
/
en
AIzaSyAYiBZKx7MnpbEhh9jyipgxe19OcubqV5w
April 1, 2024
167951
Kenya
KEN
true
2
1
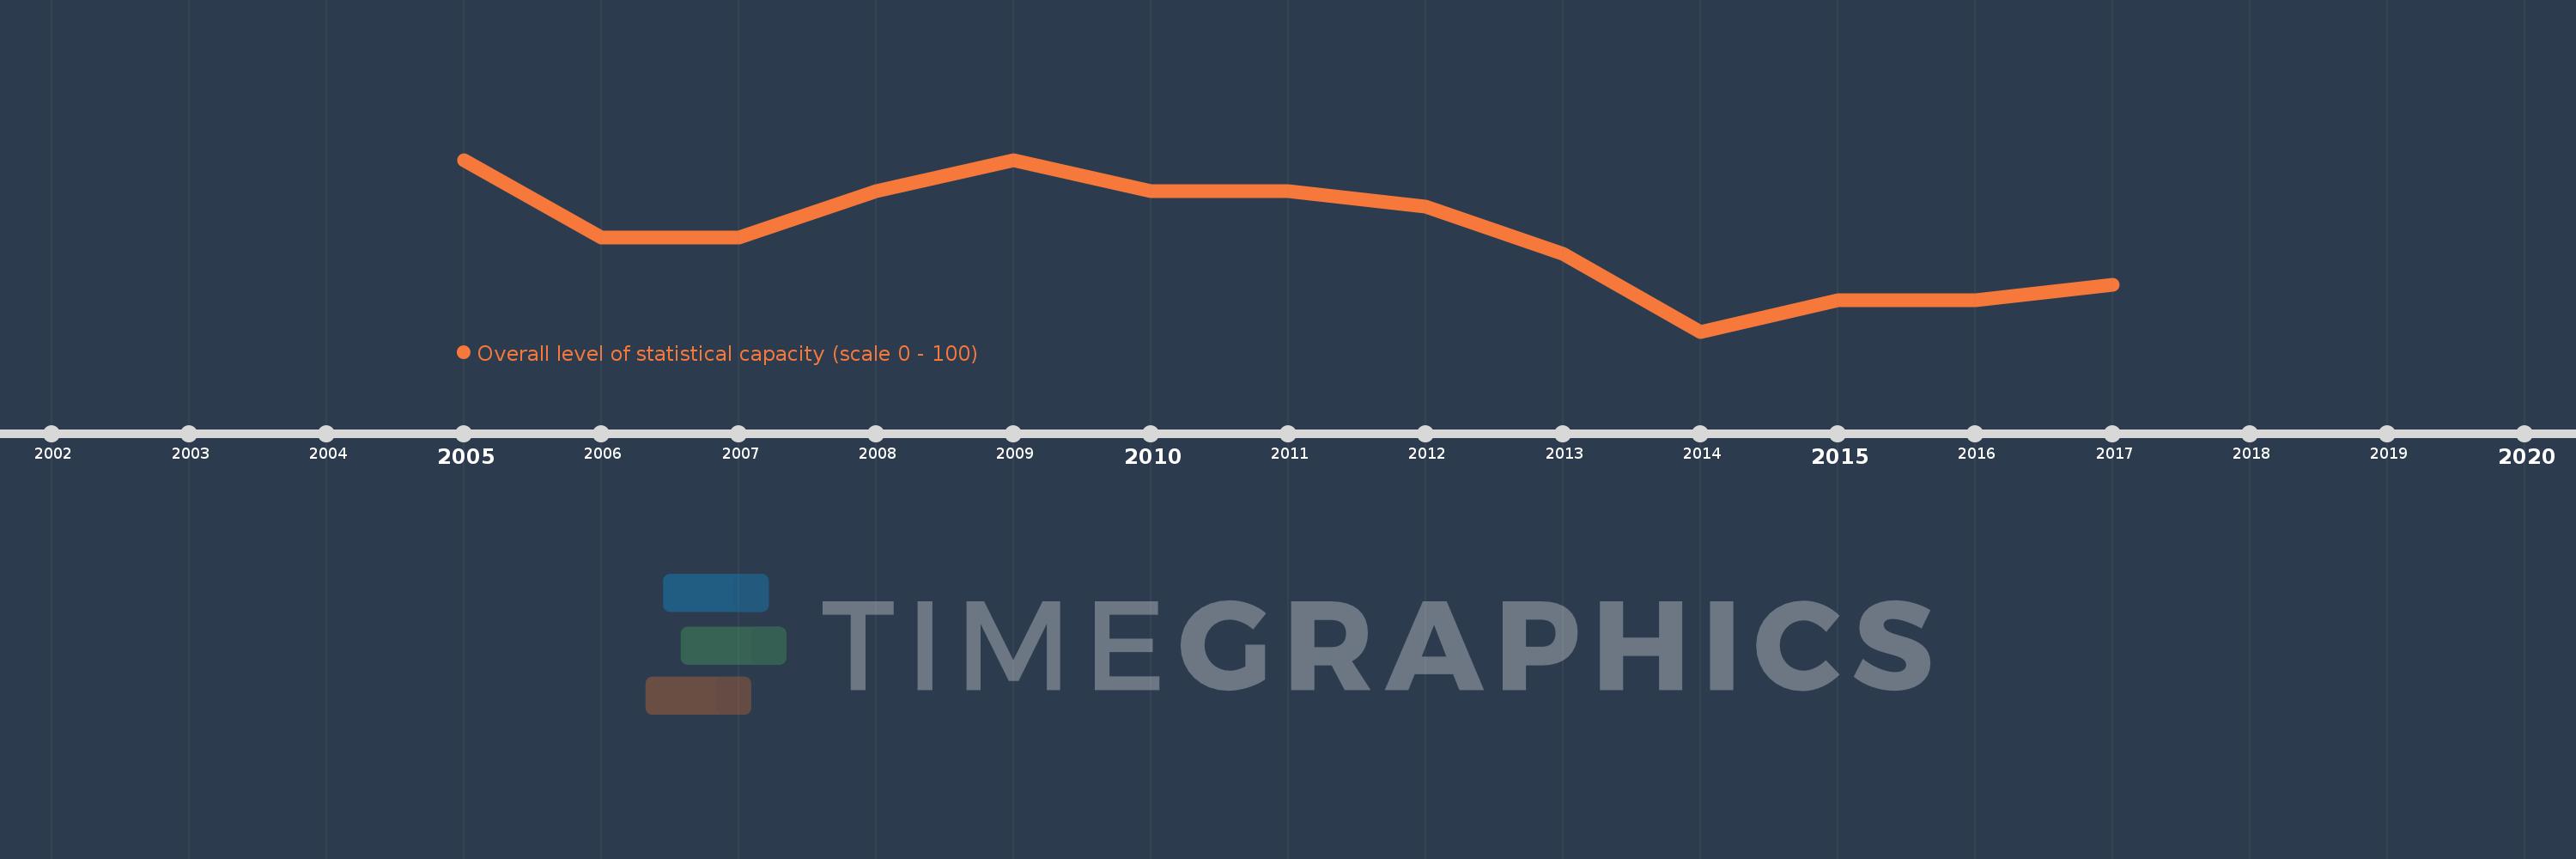
Overall level of statistical capacity (scale 0 - 100)
2017,2016,2015,2014,2013,2012,2011,2010,2009,2008,2007,2006,2005
This statistics in other country:
Timeline:
This timeline shows a graph from 2005 to 2017 of Kenya. No data until 2004. Number of actual observations by date: 13.
Source name:
World Development Indicators
Source organization:
World Bank
Categories, topics:
Public Sector
Last updated:
apr 23, 2017
Indicators value changes by year
Minimum:
52.222
jan 1, 2014
Maximum:
64.444
jan 1, 2005
At the date of observation
Value
Absolute change
Change from previous value
jan 1, 2005
64.444
+64.444
0.0%
jan 1, 2006
58.889
-5.556
-8.62%
jan 1, 2007
58.889
0.0
0.0%
jan 1, 2008
62.222
+3.333
5.66%
jan 1, 2009
64.444
+2.222
3.57%
jan 1, 2010
62.222
-2.222
-3.45%
jan 1, 2011
62.222
0.0
0.0%
jan 1, 2012
61.111
-1.111
-1.79%
jan 1, 2013
57.778
-3.333
-5.45%
jan 1, 2014
52.222
-5.556
-9.62%
jan 1, 2015
54.444
+2.222
4.26%
jan 1, 2016
54.444
0.0
0.0%
jan 1, 2017
55.556
+1.111
2.04%
Ranking of countries by current statistics by years


Comments: