29
/
en
AIzaSyAYiBZKx7MnpbEhh9jyipgxe19OcubqV5w
April 1, 2024
53695
Other small states
OSS
false
2
1
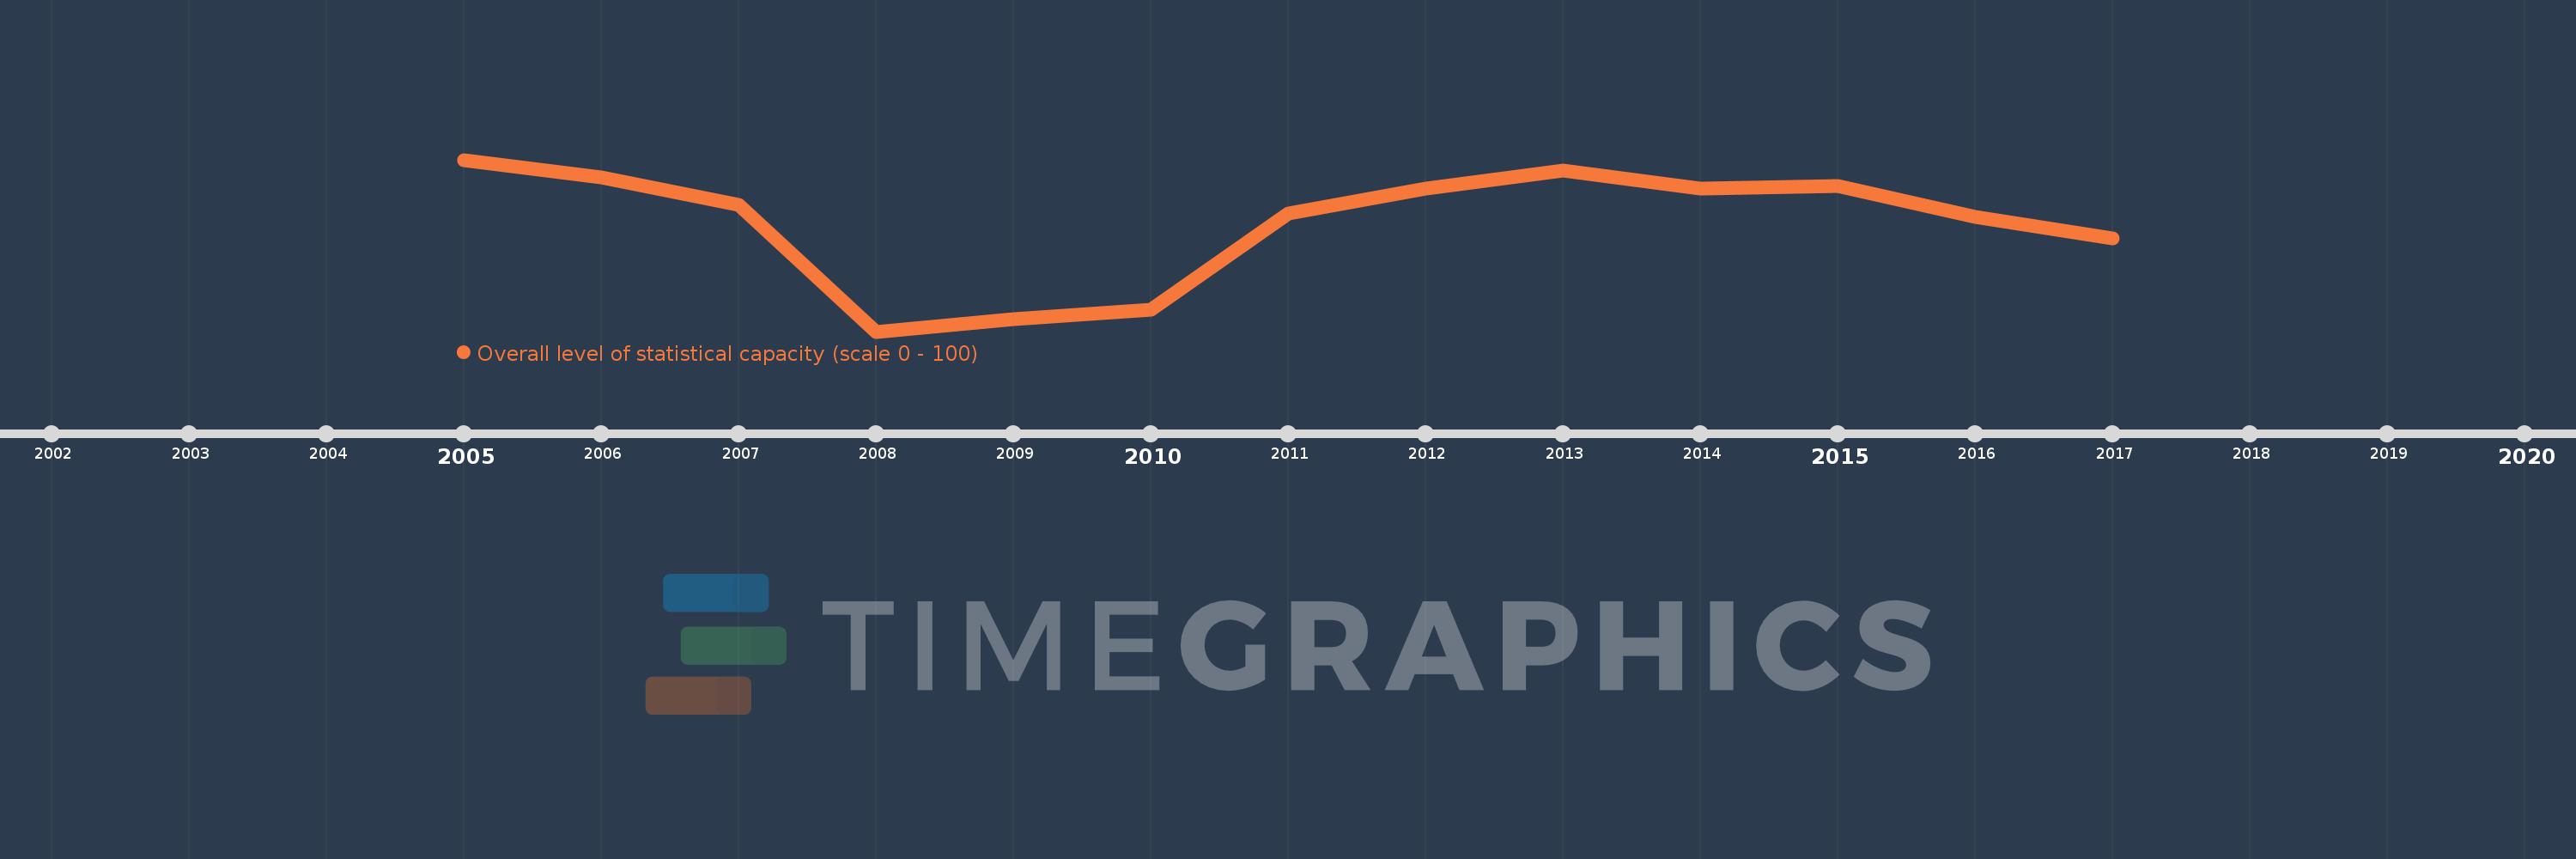
Overall level of statistical capacity (scale 0 - 100)
2017,2016,2015,2014,2013,2012,2011,2010,2009,2008,2007,2006,2005
This statistics in other country:
Timeline:
This timeline shows a graph from 2005 to 2017 of Other small states. No data until 2004. Number of actual observations by date: 13.
Source name:
World Development Indicators
Source organization:
World Bank
Categories, topics:
Public Sector
Last updated:
apr 23, 2017
Indicators value changes by year
Maximum:
60.417
jan 1, 2005
At the date of observation
Value
Absolute change
Change from previous value
jan 1, 2005
60.417
+60.417
0.0%
jan 1, 2006
59.722
-0.694
-1.15%
jan 1, 2007
58.611
-1.111
-1.86%
jan 1, 2008
53.58
-5.031
-8.58%
jan 1, 2009
54.074
+0.494
0.92%
jan 1, 2010
54.444
+0.37
0.68%
jan 1, 2011
58.272
+3.827
7.03%
jan 1, 2012
59.259
+0.988
1.69%
jan 1, 2013
60.0
+0.741
1.25%
jan 1, 2014
59.259
-0.741
-1.23%
jan 1, 2015
59.383
+0.123
0.21%
jan 1, 2016
58.148
-1.235
-2.08%
jan 1, 2017
57.284
-0.864
-1.49%
Ranking of countries by current statistics by years


Comments: