29
/
en
AIzaSyAYiBZKx7MnpbEhh9jyipgxe19OcubqV5w
April 1, 2024
47497
Lower middle income
LMC
false
2
1
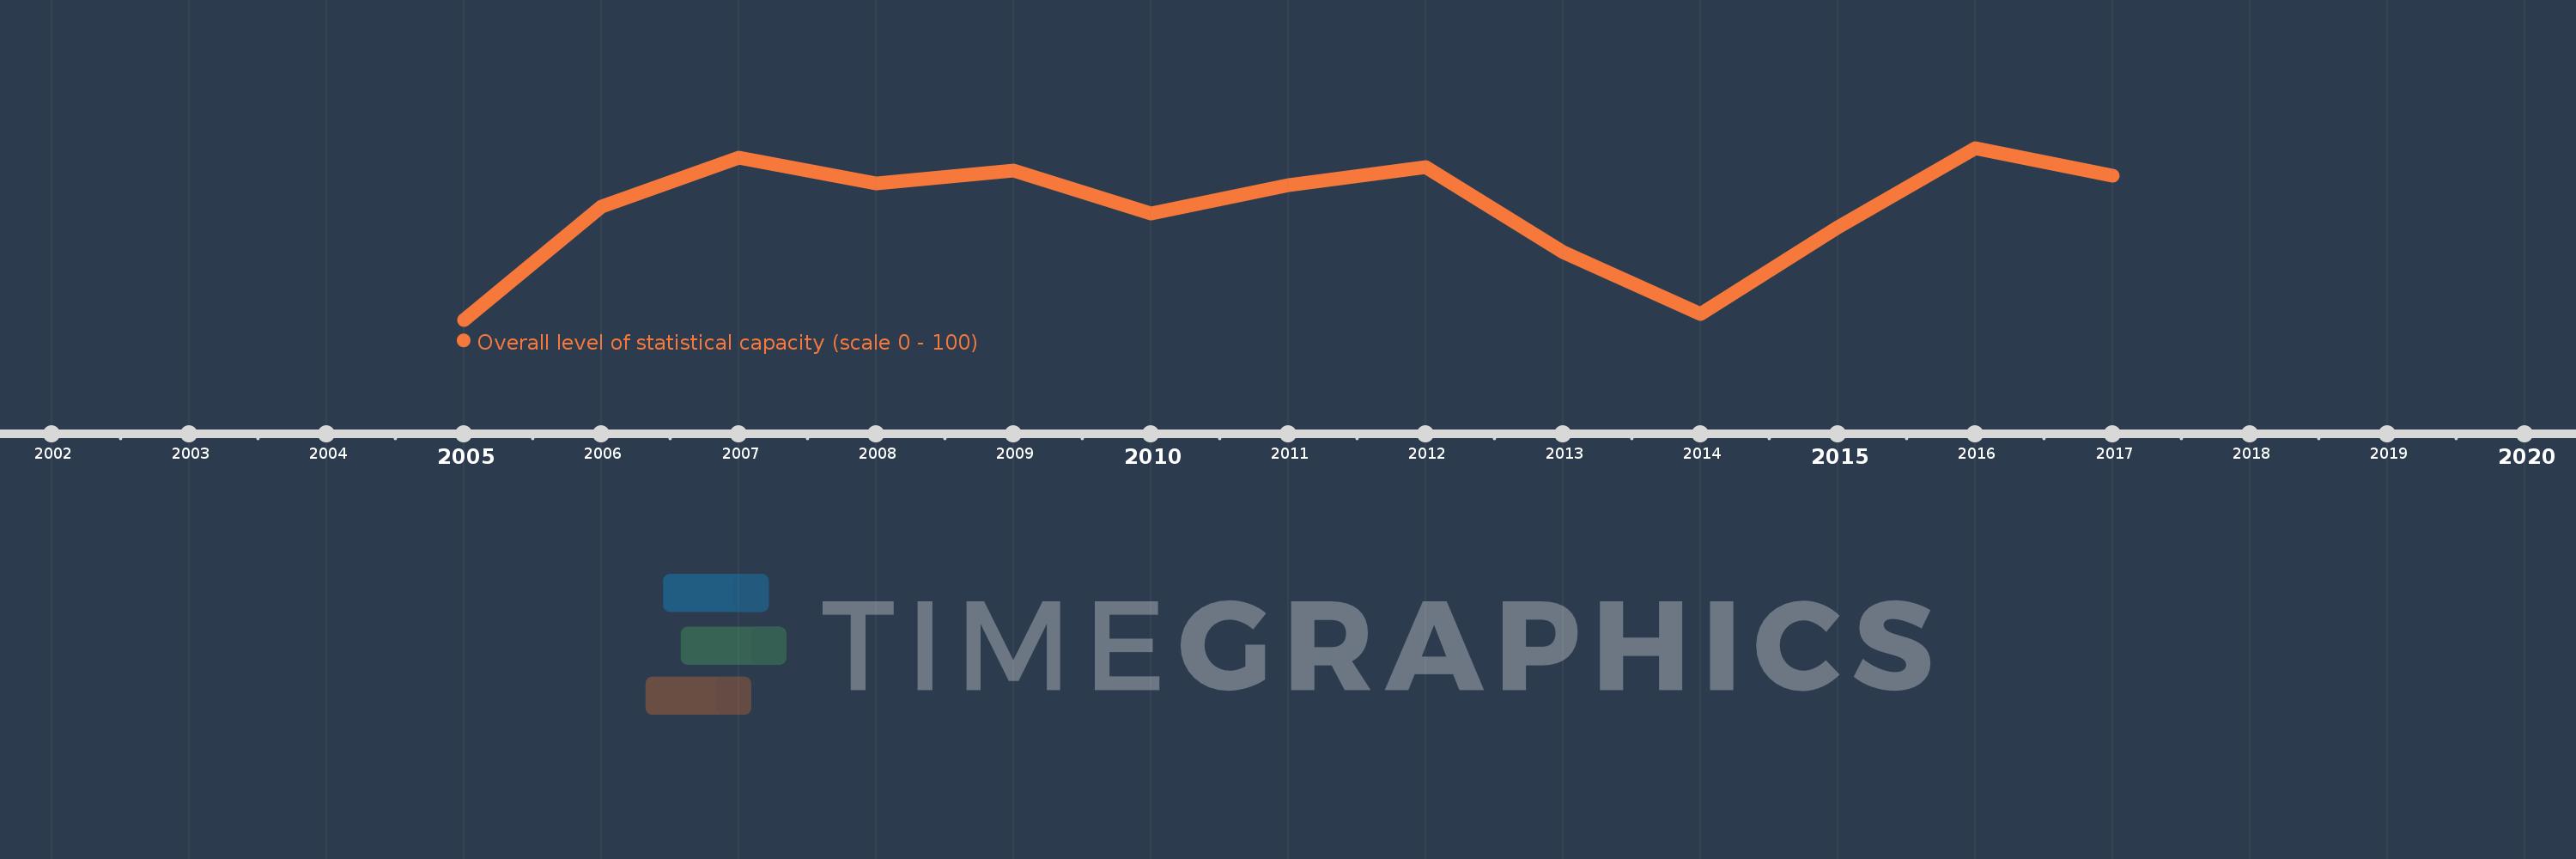
Overall level of statistical capacity (scale 0 - 100)
2017,2016,2015,2014,2013,2012,2011,2010,2009,2008,2007,2006,2005
This statistics in other country:
Timeline:
This timeline shows a graph from 2005 to 2017 of Lower middle income. No data until 2004. Number of actual observations by date: 13.
Source name:
World Development Indicators
Source organization:
World Bank
Categories, topics:
Public Sector
Last updated:
apr 23, 2017
Indicators value changes by year
Minimum:
67.635
jan 1, 2005
Maximum:
70.265
jan 1, 2016
At the date of observation
Value
Absolute change
Change from previous value
jan 1, 2005
67.635
+67.635
0.0%
jan 1, 2006
69.373
+1.738
2.57%
jan 1, 2007
70.114
+0.741
1.07%
jan 1, 2008
69.722
-0.392
-0.56%
jan 1, 2009
69.917
+0.194
0.28%
jan 1, 2010
69.268
-0.648
-0.93%
jan 1, 2011
69.702
+0.434
0.63%
jan 1, 2012
69.973
+0.271
0.39%
jan 1, 2013
68.672
-1.301
-1.86%
jan 1, 2014
67.725
-0.947
-1.38%
jan 1, 2015
69.048
+1.323
1.95%
jan 1, 2016
70.265
+1.217
1.76%
jan 1, 2017
69.841
-0.423
-0.6%
Ranking of countries by current statistics by years


Comments: