29
/
en
AIzaSyAYiBZKx7MnpbEhh9jyipgxe19OcubqV5w
April 1, 2024
36374
IBRD only
IBD
false
2
1
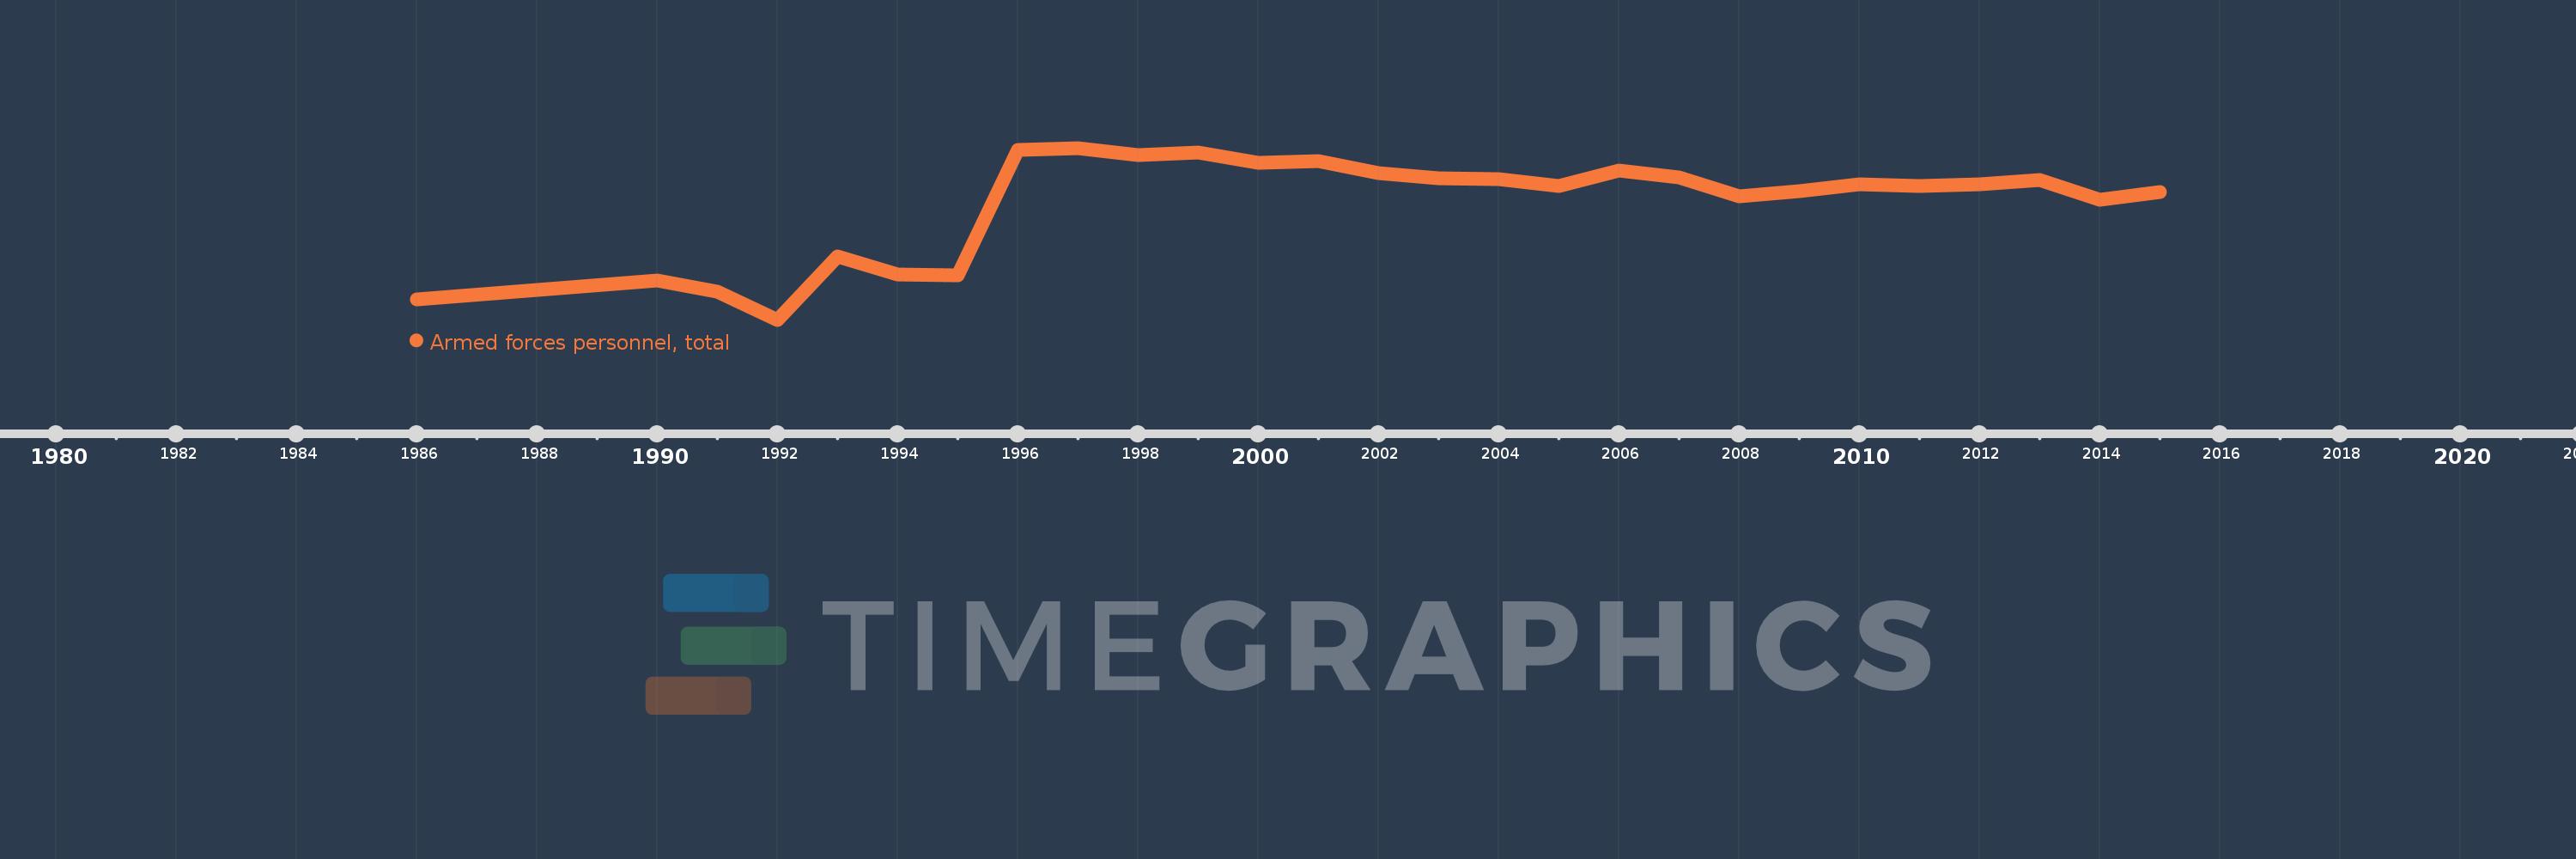
Armed forces personnel, total
2015,2014,2013,2012,2011,2010,2009,2008,2007,2006,2005,2004,2003,2002,2001,2000,1999,1998,1997,1996,1995,1994,1993,1992,1991,1990,1986
This statistics in other country:
AfghanistanAlbaniaAlgeriaAngolaAntigua and BarbudaArab WorldArgentinaArmeniaAustraliaAustriaAzerbaijanBahamas, TheBahrainBangladeshBarbadosBelarusBelgiumBelizeBeninBhutanBoliviaBosnia and HerzegovinaBotswanaBrazilBrunei DarussalamBulgariaBurkina FasoBurundiCabo VerdeCambodiaCameroonCanadaCaribbean small statesCentral African RepublicCentral Europe and the BalticsChadChileChinaColombiaCongo, Dem. Rep.Congo, Rep.Costa RicaCote d'IvoireCroatiaCubaCyprusCzech RepublicDenmarkDjiboutiDominican RepublicEarly-demographic dividendEast Asia & PacificEast Asia & Pacific (excluding high income)East Asia & Pacific (IDA & IBRD countries)EcuadorEgypt, Arab Rep.El SalvadorEquatorial GuineaEritreaEstoniaEthiopiaEuro areaEurope & Central AsiaEurope & Central Asia (excluding high income)Europe & Central Asia (IDA & IBRD countries)European UnionFijiFinlandFragile and conflict affected situationsFranceGabonGambia, TheGeorgiaGermanyGhanaGreeceGuatemalaGuineaGuinea-BissauGuyanaHaitiHeavily indebted poor countries (HIPC)High incomeHondurasHungaryIBRD onlyIcelandIDA & IBRD totalIDA blendIDA onlyIDA totalIndiaIndonesiaIran, Islamic Rep.IraqIrelandIsraelItalyJamaicaJapanJordanKazakhstanKenyaKorea, Dem. People’s Rep.Korea, Rep.KuwaitKyrgyz RepublicLao PDRLate-demographic dividendLatin America & Caribbean Latin America & Caribbean (excluding high income)Latin America & the Caribbean (IDA & IBRD countries)LatviaLeast developed countries: UN classificationLebanonLesothoLiberiaLibyaLithuaniaLow & middle incomeLow incomeLower middle incomeLuxembourgMacedonia, FYRMadagascarMalawiMalaysiaMaldivesMaliMaltaMauritaniaMauritiusMexicoMiddle East & North AfricaMiddle East & North Africa (excluding high income)Middle East & North Africa (IDA & IBRD countries)Middle incomeMoldovaMongoliaMontenegroMoroccoMozambiqueMyanmarNamibiaNepalNetherlandsNew ZealandNicaraguaNigerNigeriaNorth AmericaNorwayOECD membersOmanOther small statesPakistanPanamaPapua New GuineaParaguayPeruPhilippinesPolandPortugalPost-demographic dividendPre-demographic dividendQatarRomaniaRussian FederationRwandaSao Tome and PrincipeSaudi ArabiaSenegalSerbiaSeychellesSierra LeoneSingaporeSlovak RepublicSloveniaSmall statesSomaliaSouth AfricaSouth AsiaSouth Asia (IDA & IBRD)South SudanSpainSri LankaSub-Saharan Africa Sub-Saharan Africa (excluding high income)Sub-Saharan Africa (IDA & IBRD countries)SudanSurinameSwazilandSwedenSwitzerlandSyrian Arab RepublicTajikistanTanzaniaThailandTimor-LesteTogoTrinidad and TobagoTunisiaTurkeyTurkmenistanUgandaUkraineUnited Arab EmiratesUnited KingdomUnited StatesUpper middle incomeUruguayUzbekistanVenezuela, RBVietnamWest Bank and GazaWorldYemen, Rep.ZambiaZimbabwe Timeline:
This timeline shows a graph from 1986 to 2015 of IBRD only. No data until 1985. Number of actual observations by date: 27.
Source name:
World Development Indicators
Source organization:
International Institute for Strategic Studies, The Military Balance.
Categories, topics:
Public Sector
Last updated:
apr 23, 2017
Indicators value changes by year
Minimum:
10.253 mln
jan 1, 1992
Maximum:
16.988 mln
jan 1, 1997
At the date of observation
Value
Absolute change
Change from previous value
jan 1, 1986
11.039 mln
+11.039 mln
0.0%
jan 1, 1990
11.778 mln
+739.4K
6.7%
jan 1, 1991
11.351 mln
-427.0K
-3.63%
jan 1, 1992
10.253 mln
-1.098 mln
-9.67%
jan 1, 1993
12.74 mln
+2.487 mln
24.26%
jan 1, 1994
12.036 mln
-704.0K
-5.53%
jan 1, 1995
12.01 mln
-26.0K
-0.22%
jan 1, 1996
16.922 mln
+4.912 mln
40.9%
jan 1, 1997
16.988 mln
+65.52K
0.39%
jan 1, 1998
16.715 mln
-272.33K
-1.6%
jan 1, 1999
16.818 mln
+102.39K
0.61%
jan 1, 2000
16.402 mln
-415.75K
-2.47%
jan 1, 2001
16.462 mln
+60.37K
0.37%
jan 1, 2002
15.985 mln
-477.6K
-2.9%
jan 1, 2003
15.79 mln
-195.2K
-1.22%
jan 1, 2004
15.762 mln
-27.6K
-0.17%
jan 1, 2005
15.491 mln
-271.49K
-1.72%
jan 1, 2006
16.118 mln
+627.8K
4.05%
jan 1, 2007
15.838 mln
-280.24K
-1.74%
jan 1, 2008
15.08 mln
-757.65K
-4.78%
jan 1, 2009
15.292 mln
+211.83K
1.4%
jan 1, 2010
15.55 mln
+257.884K
1.69%
jan 1, 2011
15.507 mln
-43.025K
-0.28%
jan 1, 2012
15.558 mln
+50.724K
0.33%
jan 1, 2013
15.732 mln
+174.511K
1.12%
jan 1, 2014
14.953 mln
-779.241K
-4.95%
jan 1, 2015
15.255 mln
+301.857K
2.02%
Ranking of countries by current statistics by years


Comments: