29
/
en
AIzaSyAYiBZKx7MnpbEhh9jyipgxe19OcubqV5w
April 1, 2024
158213
Iraq
IRQ
true
2
1
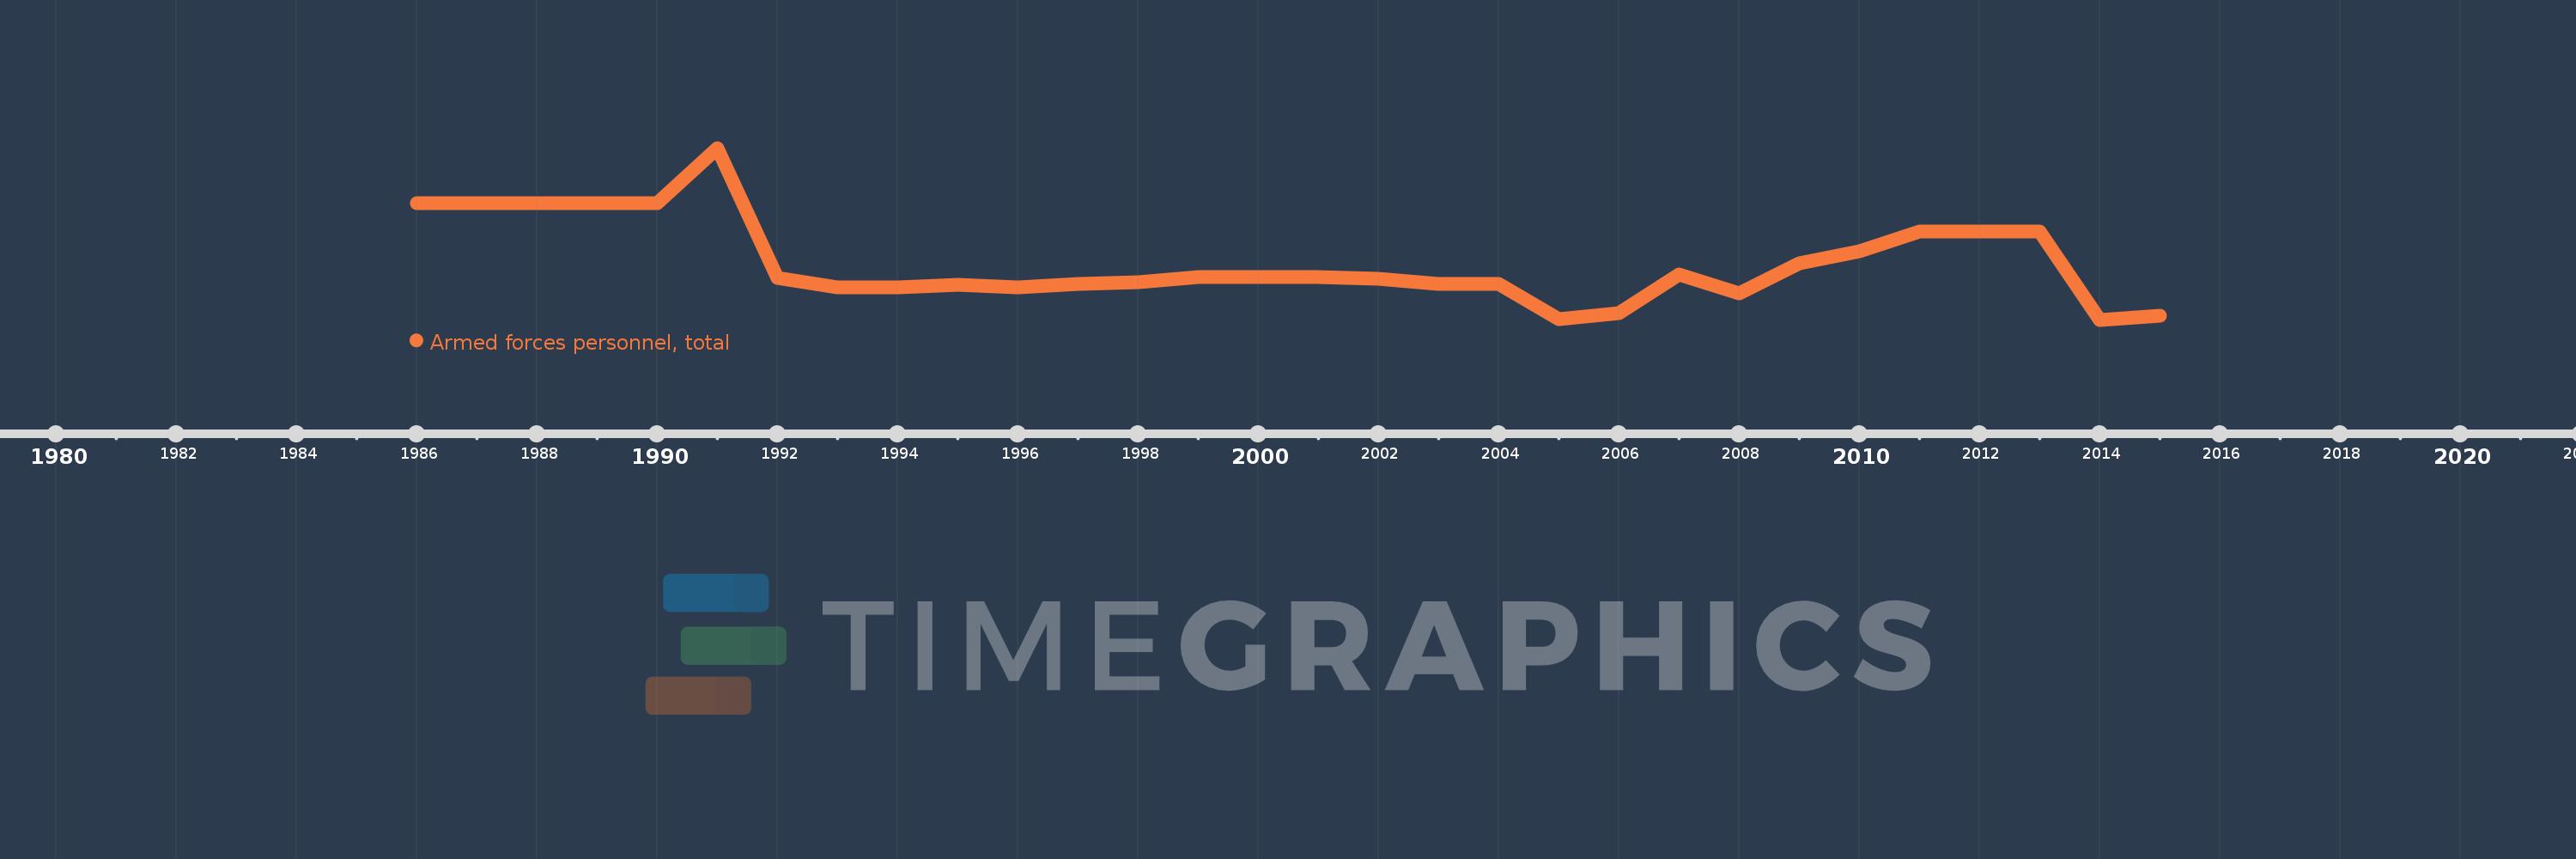
Armed forces personnel, total
2015,2014,2013,2012,2011,2010,2009,2008,2007,2006,2005,2004,2003,2002,2001,2000,1999,1998,1997,1996,1995,1994,1993,1992,1991,1990,1986
This statistics in other country:
AfghanistanAlbaniaAlgeriaAngolaAntigua and BarbudaArab WorldArgentinaArmeniaAustraliaAustriaAzerbaijanBahamas, TheBahrainBangladeshBarbadosBelarusBelgiumBelizeBeninBhutanBoliviaBosnia and HerzegovinaBotswanaBrazilBrunei DarussalamBulgariaBurkina FasoBurundiCabo VerdeCambodiaCameroonCanadaCaribbean small statesCentral African RepublicCentral Europe and the BalticsChadChileChinaColombiaCongo, Dem. Rep.Congo, Rep.Costa RicaCote d'IvoireCroatiaCubaCyprusCzech RepublicDenmarkDjiboutiDominican RepublicEarly-demographic dividendEast Asia & PacificEast Asia & Pacific (excluding high income)East Asia & Pacific (IDA & IBRD countries)EcuadorEgypt, Arab Rep.El SalvadorEquatorial GuineaEritreaEstoniaEthiopiaEuro areaEurope & Central AsiaEurope & Central Asia (excluding high income)Europe & Central Asia (IDA & IBRD countries)European UnionFijiFinlandFragile and conflict affected situationsFranceGabonGambia, TheGeorgiaGermanyGhanaGreeceGuatemalaGuineaGuinea-BissauGuyanaHaitiHeavily indebted poor countries (HIPC)High incomeHondurasHungaryIBRD onlyIcelandIDA & IBRD totalIDA blendIDA onlyIDA totalIndiaIndonesiaIran, Islamic Rep.IraqIrelandIsraelItalyJamaicaJapanJordanKazakhstanKenyaKorea, Dem. People’s Rep.Korea, Rep.KuwaitKyrgyz RepublicLao PDRLate-demographic dividendLatin America & Caribbean Latin America & Caribbean (excluding high income)Latin America & the Caribbean (IDA & IBRD countries)LatviaLeast developed countries: UN classificationLebanonLesothoLiberiaLibyaLithuaniaLow & middle incomeLow incomeLower middle incomeLuxembourgMacedonia, FYRMadagascarMalawiMalaysiaMaldivesMaliMaltaMauritaniaMauritiusMexicoMiddle East & North AfricaMiddle East & North Africa (excluding high income)Middle East & North Africa (IDA & IBRD countries)Middle incomeMoldovaMongoliaMontenegroMoroccoMozambiqueMyanmarNamibiaNepalNetherlandsNew ZealandNicaraguaNigerNigeriaNorth AmericaNorwayOECD membersOmanOther small statesPakistanPanamaPapua New GuineaParaguayPeruPhilippinesPolandPortugalPost-demographic dividendPre-demographic dividendQatarRomaniaRussian FederationRwandaSao Tome and PrincipeSaudi ArabiaSenegalSerbiaSeychellesSierra LeoneSingaporeSlovak RepublicSloveniaSmall statesSomaliaSouth AfricaSouth AsiaSouth Asia (IDA & IBRD)South SudanSpainSri LankaSub-Saharan Africa Sub-Saharan Africa (excluding high income)Sub-Saharan Africa (IDA & IBRD countries)SudanSurinameSwazilandSwedenSwitzerlandSyrian Arab RepublicTajikistanTanzaniaThailandTimor-LesteTogoTrinidad and TobagoTunisiaTurkeyTurkmenistanUgandaUkraineUnited Arab EmiratesUnited KingdomUnited StatesUpper middle incomeUruguayUzbekistanVenezuela, RBVietnamWest Bank and GazaWorldYemen, Rep.ZambiaZimbabwe Timeline:
This timeline shows a graph from 1986 to 2015 of Iraq. No data until 1985. Number of actual observations by date: 27.
Source name:
World Development Indicators
Source organization:
International Institute for Strategic Studies, The Military Balance.
Categories, topics:
Public Sector
Last updated:
apr 23, 2017
Indicators value changes by year
Minimum:
177.6K
jan 1, 2014
Maximum:
1.39 mln
jan 1, 1991
At the date of observation
Value
Absolute change
Change from previous value
jan 1, 1986
1000.0K
+1000.0K
0.0%
jan 1, 1990
1000.0K
0.0
0.0%
jan 1, 1991
1.39 mln
+390.0K
39.0%
jan 1, 1992
475.0K
-915.0K
-65.83%
jan 1, 1993
407.0K
-68.0K
-14.32%
jan 1, 1994
407.0K
0.0
0.0%
jan 1, 1995
425.0K
+18.0K
4.42%
jan 1, 1996
407.3K
-17.7K
-4.16%
jan 1, 1997
432.5K
+25.2K
6.19%
jan 1, 1998
442.9K
+10.4K
2.4%
jan 1, 1999
479.0K
+36.1K
8.15%
jan 1, 2000
479.0K
0.0
0.0%
jan 1, 2001
479.0K
0.0
0.0%
jan 1, 2002
467.0K
-12.0K
-2.51%
jan 1, 2003
432.0K
-35.0K
-7.49%
jan 1, 2004
432.0K
0.0
0.0%
jan 1, 2005
179.0K
-253.0K
-58.56%
jan 1, 2006
227.0K
+48.0K
26.82%
jan 1, 2007
495.0K
+268.0K
118.06%
jan 1, 2008
362.0K
-133.0K
-26.87%
jan 1, 2009
577.0K
+215.0K
59.39%
jan 1, 2010
659.395K
+82.395K
14.28%
jan 1, 2011
802.4K
+143.005K
21.69%
jan 1, 2012
802.4K
0.0
0.0%
jan 1, 2013
802.4K
0.0
0.0%
jan 1, 2014
177.6K
-624.8K
-77.87%
jan 1, 2015
209.0K
+31.4K
17.68%
Ranking of countries by current statistics by years


Comments: