29
/
en
AIzaSyAYiBZKx7MnpbEhh9jyipgxe19OcubqV5w
April 1, 2024
48740
Middle East & North Africa (excluding high income)
MNA
false
2
1
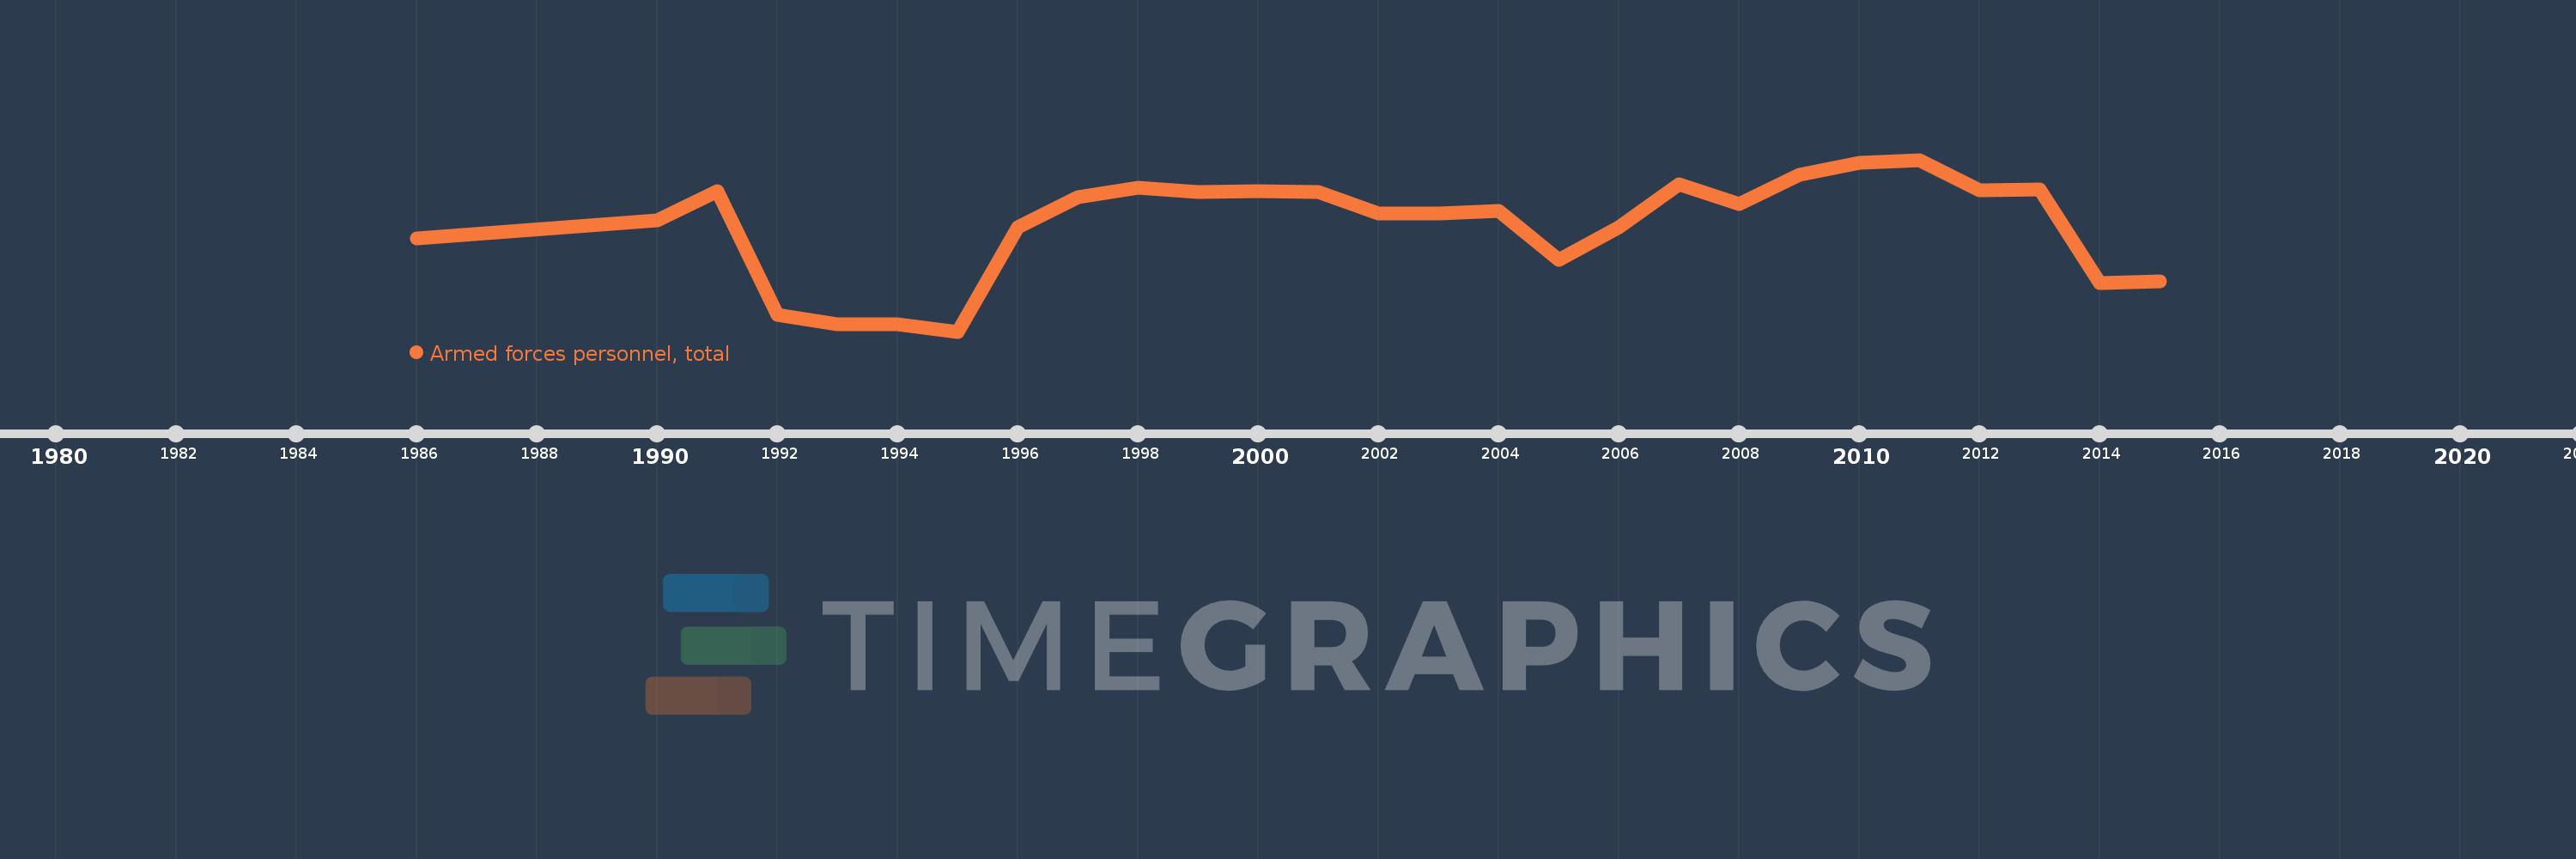
Armed forces personnel, total
2015,2014,2013,2012,2011,2010,2009,2008,2007,2006,2005,2004,2003,2002,2001,2000,1999,1998,1997,1996,1995,1994,1993,1992,1991,1990,1986
This statistics in other country:
AfghanistanAlbaniaAlgeriaAngolaAntigua and BarbudaArab WorldArgentinaArmeniaAustraliaAustriaAzerbaijanBahamas, TheBahrainBangladeshBarbadosBelarusBelgiumBelizeBeninBhutanBoliviaBosnia and HerzegovinaBotswanaBrazilBrunei DarussalamBulgariaBurkina FasoBurundiCabo VerdeCambodiaCameroonCanadaCaribbean small statesCentral African RepublicCentral Europe and the BalticsChadChileChinaColombiaCongo, Dem. Rep.Congo, Rep.Costa RicaCote d'IvoireCroatiaCubaCyprusCzech RepublicDenmarkDjiboutiDominican RepublicEarly-demographic dividendEast Asia & PacificEast Asia & Pacific (excluding high income)East Asia & Pacific (IDA & IBRD countries)EcuadorEgypt, Arab Rep.El SalvadorEquatorial GuineaEritreaEstoniaEthiopiaEuro areaEurope & Central AsiaEurope & Central Asia (excluding high income)Europe & Central Asia (IDA & IBRD countries)European UnionFijiFinlandFragile and conflict affected situationsFranceGabonGambia, TheGeorgiaGermanyGhanaGreeceGuatemalaGuineaGuinea-BissauGuyanaHaitiHeavily indebted poor countries (HIPC)High incomeHondurasHungaryIBRD onlyIcelandIDA & IBRD totalIDA blendIDA onlyIDA totalIndiaIndonesiaIran, Islamic Rep.IraqIrelandIsraelItalyJamaicaJapanJordanKazakhstanKenyaKorea, Dem. People’s Rep.Korea, Rep.KuwaitKyrgyz RepublicLao PDRLate-demographic dividendLatin America & Caribbean Latin America & Caribbean (excluding high income)Latin America & the Caribbean (IDA & IBRD countries)LatviaLeast developed countries: UN classificationLebanonLesothoLiberiaLibyaLithuaniaLow & middle incomeLow incomeLower middle incomeLuxembourgMacedonia, FYRMadagascarMalawiMalaysiaMaldivesMaliMaltaMauritaniaMauritiusMexicoMiddle East & North AfricaMiddle East & North Africa (excluding high income)Middle East & North Africa (IDA & IBRD countries)Middle incomeMoldovaMongoliaMontenegroMoroccoMozambiqueMyanmarNamibiaNepalNetherlandsNew ZealandNicaraguaNigerNigeriaNorth AmericaNorwayOECD membersOmanOther small statesPakistanPanamaPapua New GuineaParaguayPeruPhilippinesPolandPortugalPost-demographic dividendPre-demographic dividendQatarRomaniaRussian FederationRwandaSao Tome and PrincipeSaudi ArabiaSenegalSerbiaSeychellesSierra LeoneSingaporeSlovak RepublicSloveniaSmall statesSomaliaSouth AfricaSouth AsiaSouth Asia (IDA & IBRD)South SudanSpainSri LankaSub-Saharan Africa Sub-Saharan Africa (excluding high income)Sub-Saharan Africa (IDA & IBRD countries)SudanSurinameSwazilandSwedenSwitzerlandSyrian Arab RepublicTajikistanTanzaniaThailandTimor-LesteTogoTrinidad and TobagoTunisiaTurkeyTurkmenistanUgandaUkraineUnited Arab EmiratesUnited KingdomUnited StatesUpper middle incomeUruguayUzbekistanVenezuela, RBVietnamWest Bank and GazaWorldYemen, Rep.ZambiaZimbabwe Timeline:
This timeline shows a graph from 1986 to 2015 of Middle East & North Africa (excluding high income). No data until 1985. Number of actual observations by date: 27.
Source name:
World Development Indicators
Source organization:
International Institute for Strategic Studies, The Military Balance.
Categories, topics:
Public Sector
Last updated:
apr 23, 2017
Indicators value changes by year
Minimum:
2.366 mln
jan 1, 1995
Maximum:
3.611 mln
jan 1, 2011
At the date of observation
Value
Absolute change
Change from previous value
jan 1, 1986
3.039 mln
+3.039 mln
0.0%
jan 1, 1990
3.175 mln
+135.6K
4.46%
jan 1, 1991
3.381 mln
+206.0K
6.49%
jan 1, 1992
2.49 mln
-891.0K
-26.35%
jan 1, 1993
2.417 mln
-73.0K
-2.93%
jan 1, 1994
2.417 mln
0.0
0.0%
jan 1, 1995
2.366 mln
-51.0K
-2.11%
jan 1, 1996
3.124 mln
+758.2K
32.05%
jan 1, 1997
3.342 mln
+217.4K
6.96%
jan 1, 1998
3.406 mln
+64.85K
1.94%
jan 1, 1999
3.377 mln
-29.4K
-0.86%
jan 1, 2000
3.386 mln
+9.35K
0.28%
jan 1, 2001
3.379 mln
-7.5K
-0.22%
jan 1, 2002
3.224 mln
-155.1K
-4.59%
jan 1, 2003
3.224 mln
-300.0
-0.01%
jan 1, 2004
3.242 mln
+18.6K
0.58%
jan 1, 2005
2.885 mln
-357.1K
-11.01%
jan 1, 2006
3.123 mln
+238.0K
8.25%
jan 1, 2007
3.432 mln
+309.0K
9.89%
jan 1, 2008
3.289 mln
-143.0K
-4.17%
jan 1, 2009
3.505 mln
+216.0K
6.57%
jan 1, 2010
3.591 mln
+86.145K
2.46%
jan 1, 2011
3.611 mln
+20.005K
0.56%
jan 1, 2012
3.387 mln
-224.1K
-6.21%
jan 1, 2013
3.399 mln
+12.0K
0.35%
jan 1, 2014
2.718 mln
-680.8K
-20.03%
jan 1, 2015
2.727 mln
+9.0K
0.33%
Ranking of countries by current statistics by years


Comments: