29
/
en
AIzaSyAYiBZKx7MnpbEhh9jyipgxe19OcubqV5w
April 1, 2024
31322
Europe & Central Asia (excluding high income)
ECA
false
2
1
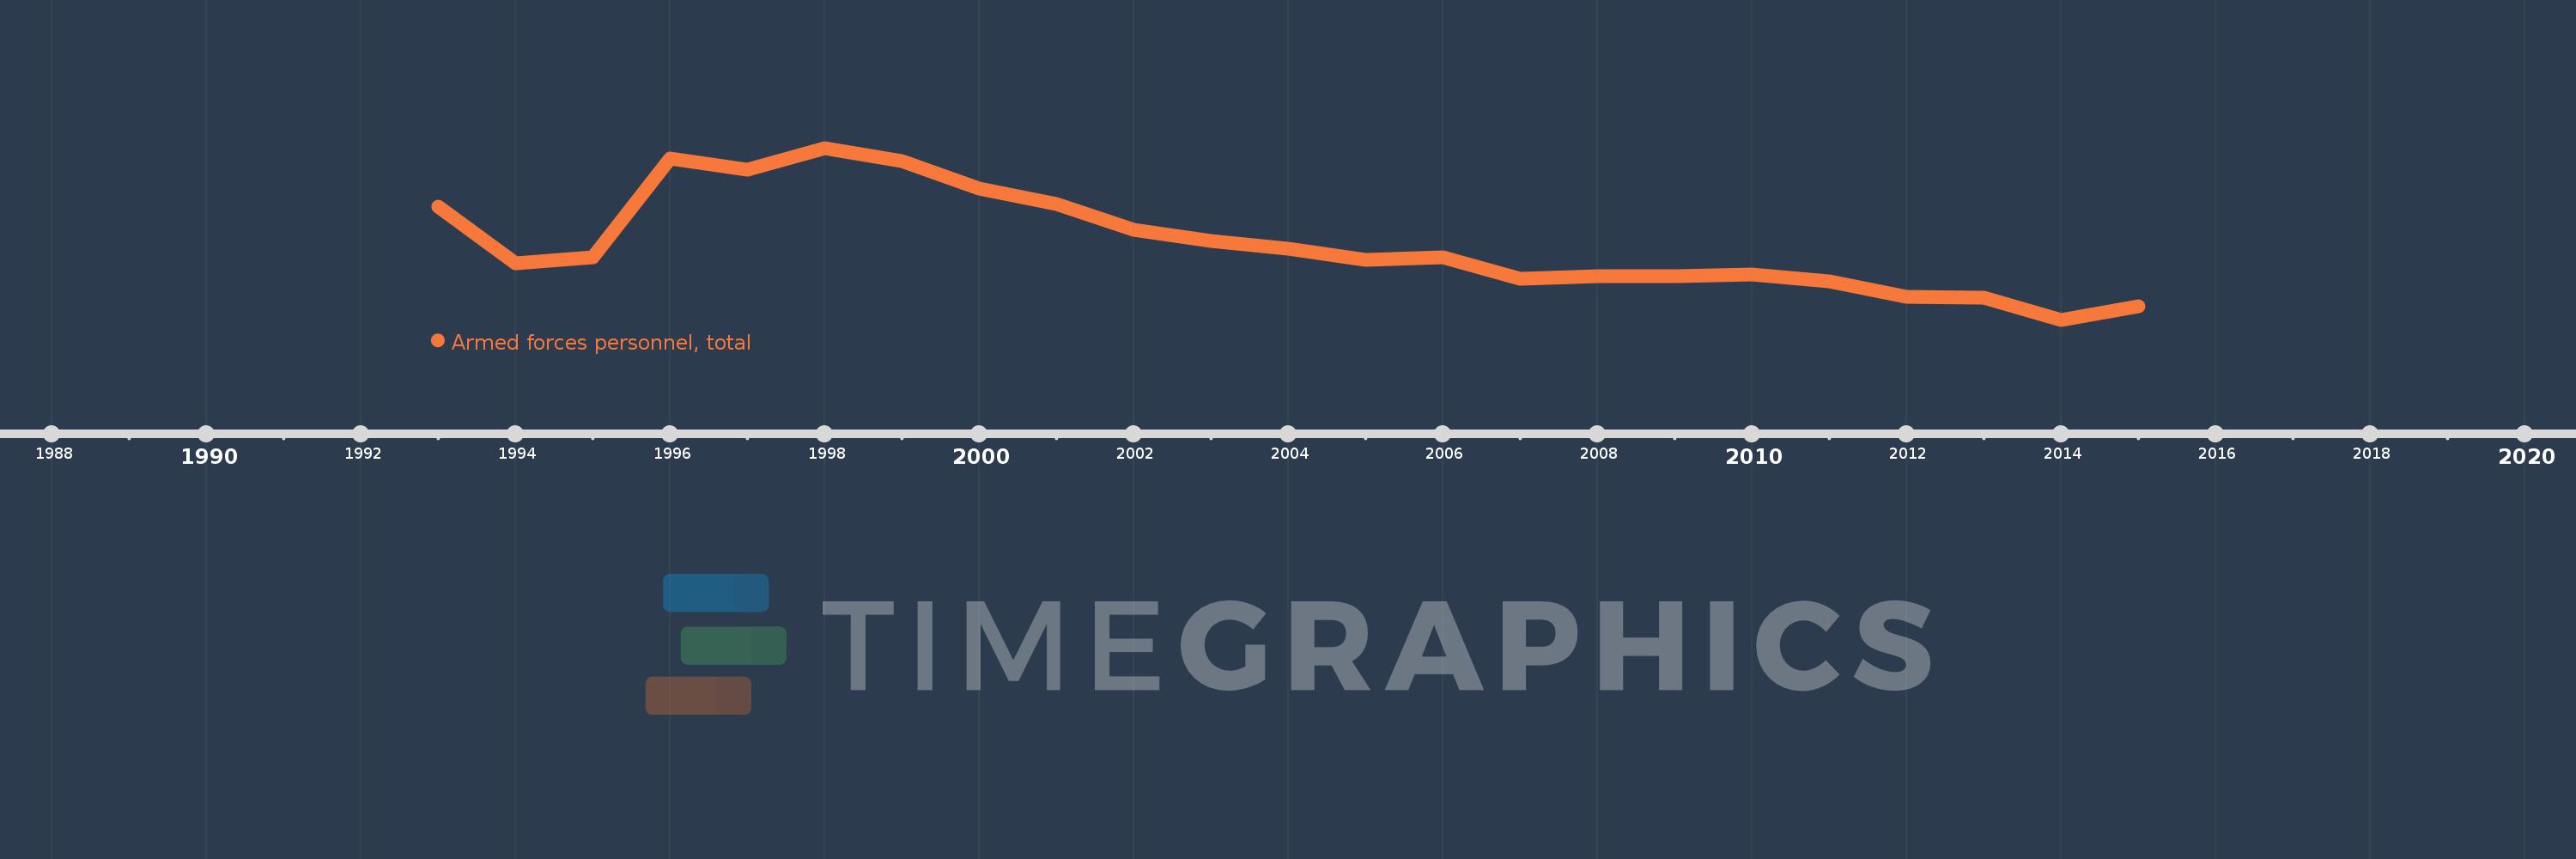
Armed forces personnel, total
2015,2014,2013,2012,2011,2010,2009,2008,2007,2006,2005,2004,2003,2002,2001,2000,1999,1998,1997,1996,1995,1994,1993
This statistics in other country:
AfghanistanAlbaniaAlgeriaAngolaAntigua and BarbudaArab WorldArgentinaArmeniaAustraliaAustriaAzerbaijanBahamas, TheBahrainBangladeshBarbadosBelarusBelgiumBelizeBeninBhutanBoliviaBosnia and HerzegovinaBotswanaBrazilBrunei DarussalamBulgariaBurkina FasoBurundiCabo VerdeCambodiaCameroonCanadaCaribbean small statesCentral African RepublicCentral Europe and the BalticsChadChileChinaColombiaCongo, Dem. Rep.Congo, Rep.Costa RicaCote d'IvoireCroatiaCubaCyprusCzech RepublicDenmarkDjiboutiDominican RepublicEarly-demographic dividendEast Asia & PacificEast Asia & Pacific (excluding high income)East Asia & Pacific (IDA & IBRD countries)EcuadorEgypt, Arab Rep.El SalvadorEquatorial GuineaEritreaEstoniaEthiopiaEuro areaEurope & Central AsiaEurope & Central Asia (excluding high income)Europe & Central Asia (IDA & IBRD countries)European UnionFijiFinlandFragile and conflict affected situationsFranceGabonGambia, TheGeorgiaGermanyGhanaGreeceGuatemalaGuineaGuinea-BissauGuyanaHaitiHeavily indebted poor countries (HIPC)High incomeHondurasHungaryIBRD onlyIcelandIDA & IBRD totalIDA blendIDA onlyIDA totalIndiaIndonesiaIran, Islamic Rep.IraqIrelandIsraelItalyJamaicaJapanJordanKazakhstanKenyaKorea, Dem. People’s Rep.Korea, Rep.KuwaitKyrgyz RepublicLao PDRLate-demographic dividendLatin America & Caribbean Latin America & Caribbean (excluding high income)Latin America & the Caribbean (IDA & IBRD countries)LatviaLeast developed countries: UN classificationLebanonLesothoLiberiaLibyaLithuaniaLow & middle incomeLow incomeLower middle incomeLuxembourgMacedonia, FYRMadagascarMalawiMalaysiaMaldivesMaliMaltaMauritaniaMauritiusMexicoMiddle East & North AfricaMiddle East & North Africa (excluding high income)Middle East & North Africa (IDA & IBRD countries)Middle incomeMoldovaMongoliaMontenegroMoroccoMozambiqueMyanmarNamibiaNepalNetherlandsNew ZealandNicaraguaNigerNigeriaNorth AmericaNorwayOECD membersOmanOther small statesPakistanPanamaPapua New GuineaParaguayPeruPhilippinesPolandPortugalPost-demographic dividendPre-demographic dividendQatarRomaniaRussian FederationRwandaSao Tome and PrincipeSaudi ArabiaSenegalSerbiaSeychellesSierra LeoneSingaporeSlovak RepublicSloveniaSmall statesSomaliaSouth AfricaSouth AsiaSouth Asia (IDA & IBRD)South SudanSpainSri LankaSub-Saharan Africa Sub-Saharan Africa (excluding high income)Sub-Saharan Africa (IDA & IBRD countries)SudanSurinameSwazilandSwedenSwitzerlandSyrian Arab RepublicTajikistanTanzaniaThailandTimor-LesteTogoTrinidad and TobagoTunisiaTurkeyTurkmenistanUgandaUkraineUnited Arab EmiratesUnited KingdomUnited StatesUpper middle incomeUruguayUzbekistanVenezuela, RBVietnamWest Bank and GazaWorldYemen, Rep.ZambiaZimbabwe Timeline:
This timeline shows a graph from 1993 to 2015 of Europe & Central Asia (excluding high income). No data until 1992. Number of actual observations by date: 23.
Source name:
World Development Indicators
Source organization:
International Institute for Strategic Studies, The Military Balance.
Categories, topics:
Public Sector
Last updated:
apr 23, 2017
Indicators value changes by year
Minimum:
2.787 mln
jan 1, 2014
Maximum:
4.377 mln
jan 1, 1998
At the date of observation
Value
Absolute change
Change from previous value
jan 1, 1993
3.834 mln
+3.834 mln
0.0%
jan 1, 1994
3.311 mln
-523.0K
-13.64%
jan 1, 1995
3.363 mln
+52.0K
1.57%
jan 1, 1996
4.277 mln
+914.4K
27.19%
jan 1, 1997
4.172 mln
-105.2K
-2.46%
jan 1, 1998
4.377 mln
+204.68K
4.91%
jan 1, 1999
4.256 mln
-120.83K
-2.76%
jan 1, 2000
3.998 mln
-257.64K
-6.05%
jan 1, 2001
3.855 mln
-143.71K
-3.59%
jan 1, 2002
3.623 mln
-232.1K
-6.02%
jan 1, 2003
3.519 mln
-103.7K
-2.86%
jan 1, 2004
3.444 mln
-75.0K
-2.13%
jan 1, 2005
3.345 mln
-99.4K
-2.89%
jan 1, 2006
3.364 mln
+19.0K
0.57%
jan 1, 2007
3.163 mln
-201.0K
-5.98%
jan 1, 2008
3.189 mln
+27.0K
0.85%
jan 1, 2009
3.189 mln
0.0
0.0%
jan 1, 2010
3.202 mln
+12.497K
0.39%
jan 1, 2011
3.139 mln
-63.03K
-1.97%
jan 1, 2012
2.997 mln
-142.293K
-4.53%
jan 1, 2013
2.99 mln
-6.494K
-0.22%
jan 1, 2014
2.787 mln
-203.6K
-6.81%
jan 1, 2015
2.911 mln
+124.0K
4.45%
Ranking of countries by current statistics by years


Comments: