29
/
en
AIzaSyAYiBZKx7MnpbEhh9jyipgxe19OcubqV5w
April 1, 2024
35551
High income
HIC
false
2
1
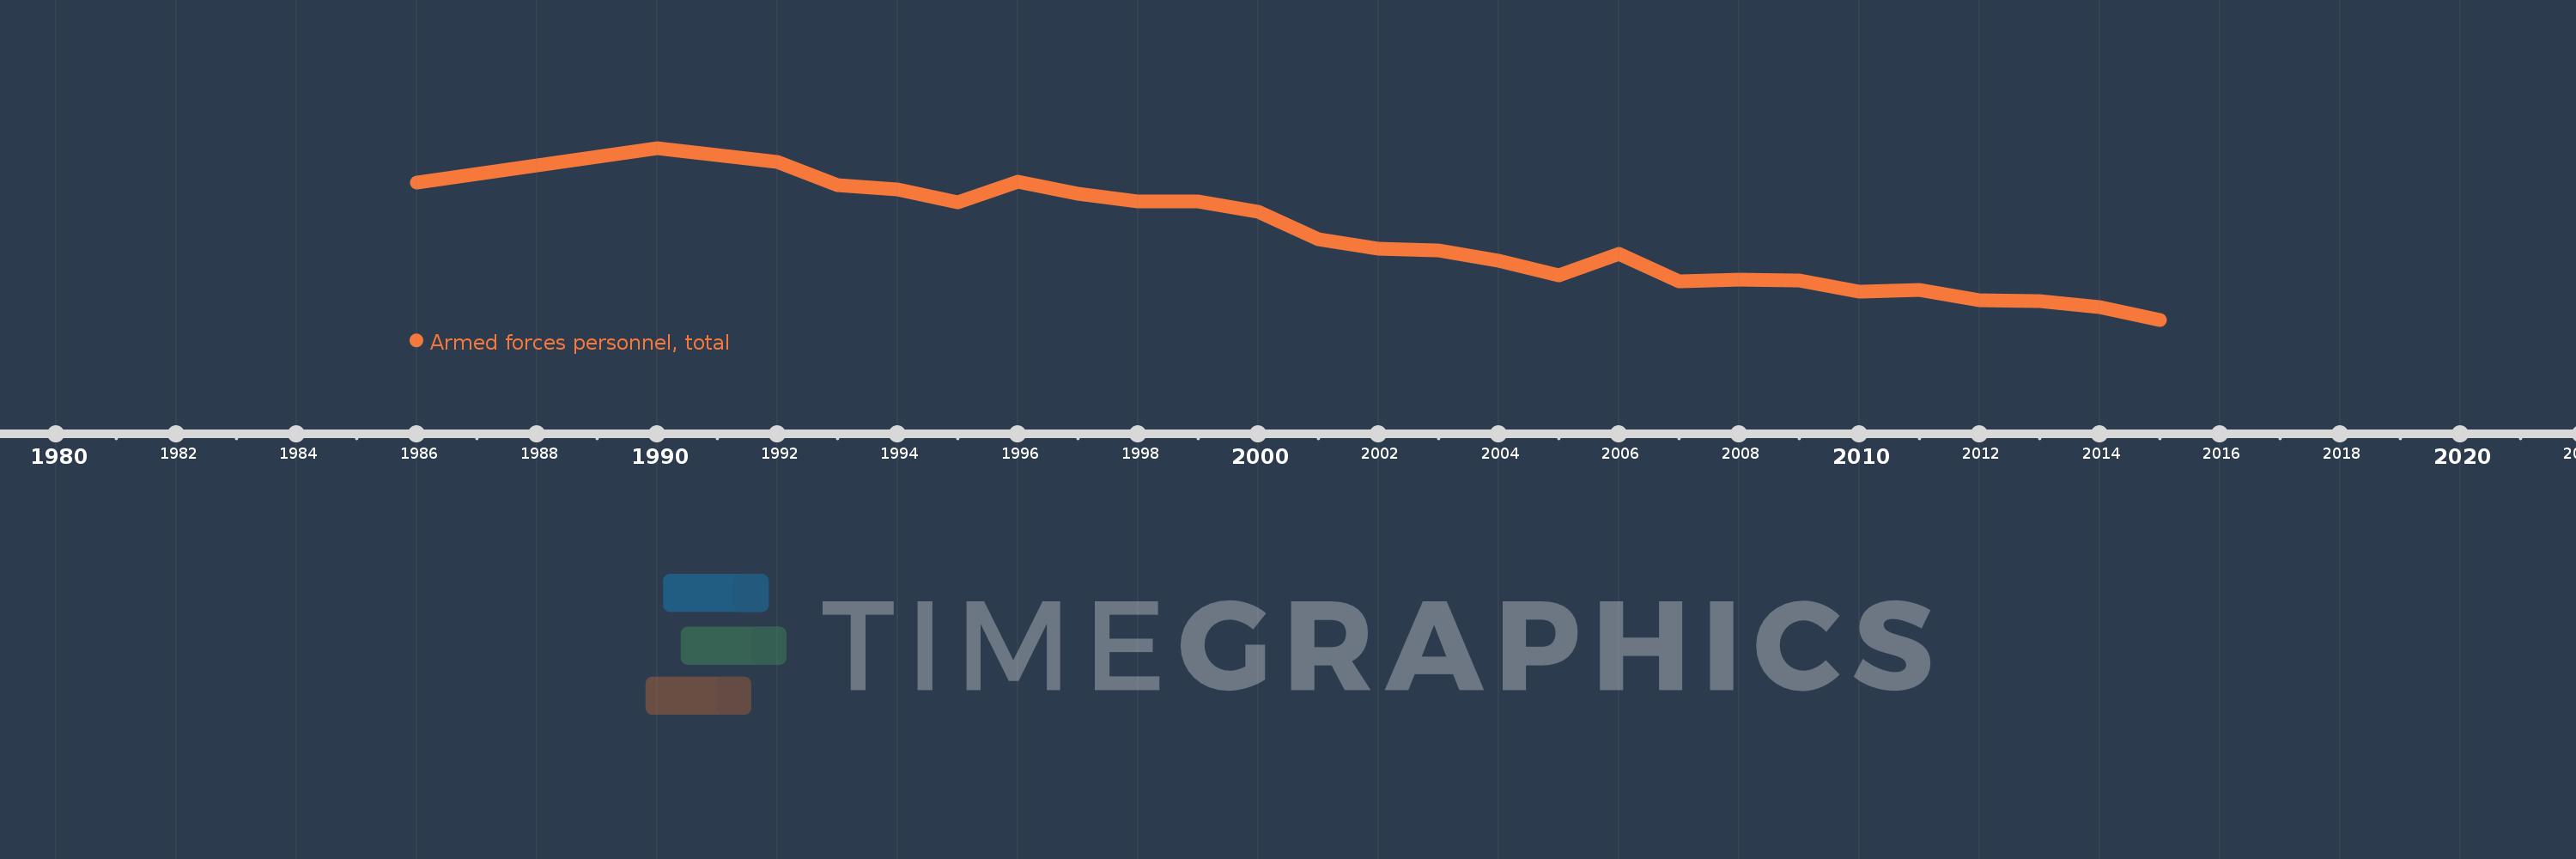
Armed forces personnel, total
2015,2014,2013,2012,2011,2010,2009,2008,2007,2006,2005,2004,2003,2002,2001,2000,1999,1998,1997,1996,1995,1994,1993,1992,1991,1990,1986
This statistics in other country:
AfghanistanAlbaniaAlgeriaAngolaAntigua and BarbudaArab WorldArgentinaArmeniaAustraliaAustriaAzerbaijanBahamas, TheBahrainBangladeshBarbadosBelarusBelgiumBelizeBeninBhutanBoliviaBosnia and HerzegovinaBotswanaBrazilBrunei DarussalamBulgariaBurkina FasoBurundiCabo VerdeCambodiaCameroonCanadaCaribbean small statesCentral African RepublicCentral Europe and the BalticsChadChileChinaColombiaCongo, Dem. Rep.Congo, Rep.Costa RicaCote d'IvoireCroatiaCubaCyprusCzech RepublicDenmarkDjiboutiDominican RepublicEarly-demographic dividendEast Asia & PacificEast Asia & Pacific (excluding high income)East Asia & Pacific (IDA & IBRD countries)EcuadorEgypt, Arab Rep.El SalvadorEquatorial GuineaEritreaEstoniaEthiopiaEuro areaEurope & Central AsiaEurope & Central Asia (excluding high income)Europe & Central Asia (IDA & IBRD countries)European UnionFijiFinlandFragile and conflict affected situationsFranceGabonGambia, TheGeorgiaGermanyGhanaGreeceGuatemalaGuineaGuinea-BissauGuyanaHaitiHeavily indebted poor countries (HIPC)High incomeHondurasHungaryIBRD onlyIcelandIDA & IBRD totalIDA blendIDA onlyIDA totalIndiaIndonesiaIran, Islamic Rep.IraqIrelandIsraelItalyJamaicaJapanJordanKazakhstanKenyaKorea, Dem. People’s Rep.Korea, Rep.KuwaitKyrgyz RepublicLao PDRLate-demographic dividendLatin America & Caribbean Latin America & Caribbean (excluding high income)Latin America & the Caribbean (IDA & IBRD countries)LatviaLeast developed countries: UN classificationLebanonLesothoLiberiaLibyaLithuaniaLow & middle incomeLow incomeLower middle incomeLuxembourgMacedonia, FYRMadagascarMalawiMalaysiaMaldivesMaliMaltaMauritaniaMauritiusMexicoMiddle East & North AfricaMiddle East & North Africa (excluding high income)Middle East & North Africa (IDA & IBRD countries)Middle incomeMoldovaMongoliaMontenegroMoroccoMozambiqueMyanmarNamibiaNepalNetherlandsNew ZealandNicaraguaNigerNigeriaNorth AmericaNorwayOECD membersOmanOther small statesPakistanPanamaPapua New GuineaParaguayPeruPhilippinesPolandPortugalPost-demographic dividendPre-demographic dividendQatarRomaniaRussian FederationRwandaSao Tome and PrincipeSaudi ArabiaSenegalSerbiaSeychellesSierra LeoneSingaporeSlovak RepublicSloveniaSmall statesSomaliaSouth AfricaSouth AsiaSouth Asia (IDA & IBRD)South SudanSpainSri LankaSub-Saharan Africa Sub-Saharan Africa (excluding high income)Sub-Saharan Africa (IDA & IBRD countries)SudanSurinameSwazilandSwedenSwitzerlandSyrian Arab RepublicTajikistanTanzaniaThailandTimor-LesteTogoTrinidad and TobagoTunisiaTurkeyTurkmenistanUgandaUkraineUnited Arab EmiratesUnited KingdomUnited StatesUpper middle incomeUruguayUzbekistanVenezuela, RBVietnamWest Bank and GazaWorldYemen, Rep.ZambiaZimbabwe Timeline:
This timeline shows a graph from 1986 to 2015 of High income. No data until 1985. Number of actual observations by date: 27.
Source name:
World Development Indicators
Source organization:
International Institute for Strategic Studies, The Military Balance.
Categories, topics:
Public Sector
Last updated:
apr 23, 2017
Indicators value changes by year
Minimum:
5.538 mln
jan 1, 2015
Maximum:
7.679 mln
jan 1, 1990
At the date of observation
Value
Absolute change
Change from previous value
jan 1, 1986
7.244 mln
+7.244 mln
0.0%
jan 1, 1990
7.679 mln
+435.5K
6.01%
jan 1, 1991
7.591 mln
-88.0K
-1.15%
jan 1, 1992
7.502 mln
-89.0K
-1.17%
jan 1, 1993
7.217 mln
-285.0K
-3.8%
jan 1, 1994
7.157 mln
-60.0K
-0.83%
jan 1, 1995
7.006 mln
-151.0K
-2.11%
jan 1, 1996
7.263 mln
+257.0K
3.67%
jan 1, 1997
7.104 mln
-158.56K
-2.18%
jan 1, 1998
7.017 mln
-87.24K
-1.23%
jan 1, 1999
7.013 mln
-4.57K
-0.07%
jan 1, 2000
6.885 mln
-127.3K
-1.82%
jan 1, 2001
6.545 mln
-340.13K
-4.94%
jan 1, 2002
6.426 mln
-119.6K
-1.83%
jan 1, 2003
6.401 mln
-25.1K
-0.39%
jan 1, 2004
6.271 mln
-129.8K
-2.03%
jan 1, 2005
6.091 mln
-179.378K
-2.86%
jan 1, 2006
6.354 mln
+262.55K
4.31%
jan 1, 2007
6.02 mln
-334.24K
-5.26%
jan 1, 2008
6.042 mln
+22.35K
0.37%
jan 1, 2009
6.024 mln
-17.54K
-0.29%
jan 1, 2010
5.883 mln
-141.091K
-2.34%
jan 1, 2011
5.912 mln
+28.475K
0.48%
jan 1, 2012
5.775 mln
-136.36K
-2.31%
jan 1, 2013
5.774 mln
-1.196K
-0.02%
jan 1, 2014
5.699 mln
-75.43K
-1.31%
jan 1, 2015
5.538 mln
-161.25K
-2.83%
Ranking of countries by current statistics by years


Comments: