29
/
en
AIzaSyAYiBZKx7MnpbEhh9jyipgxe19OcubqV5w
April 1, 2024
35677
High income
HIC
false
2
1
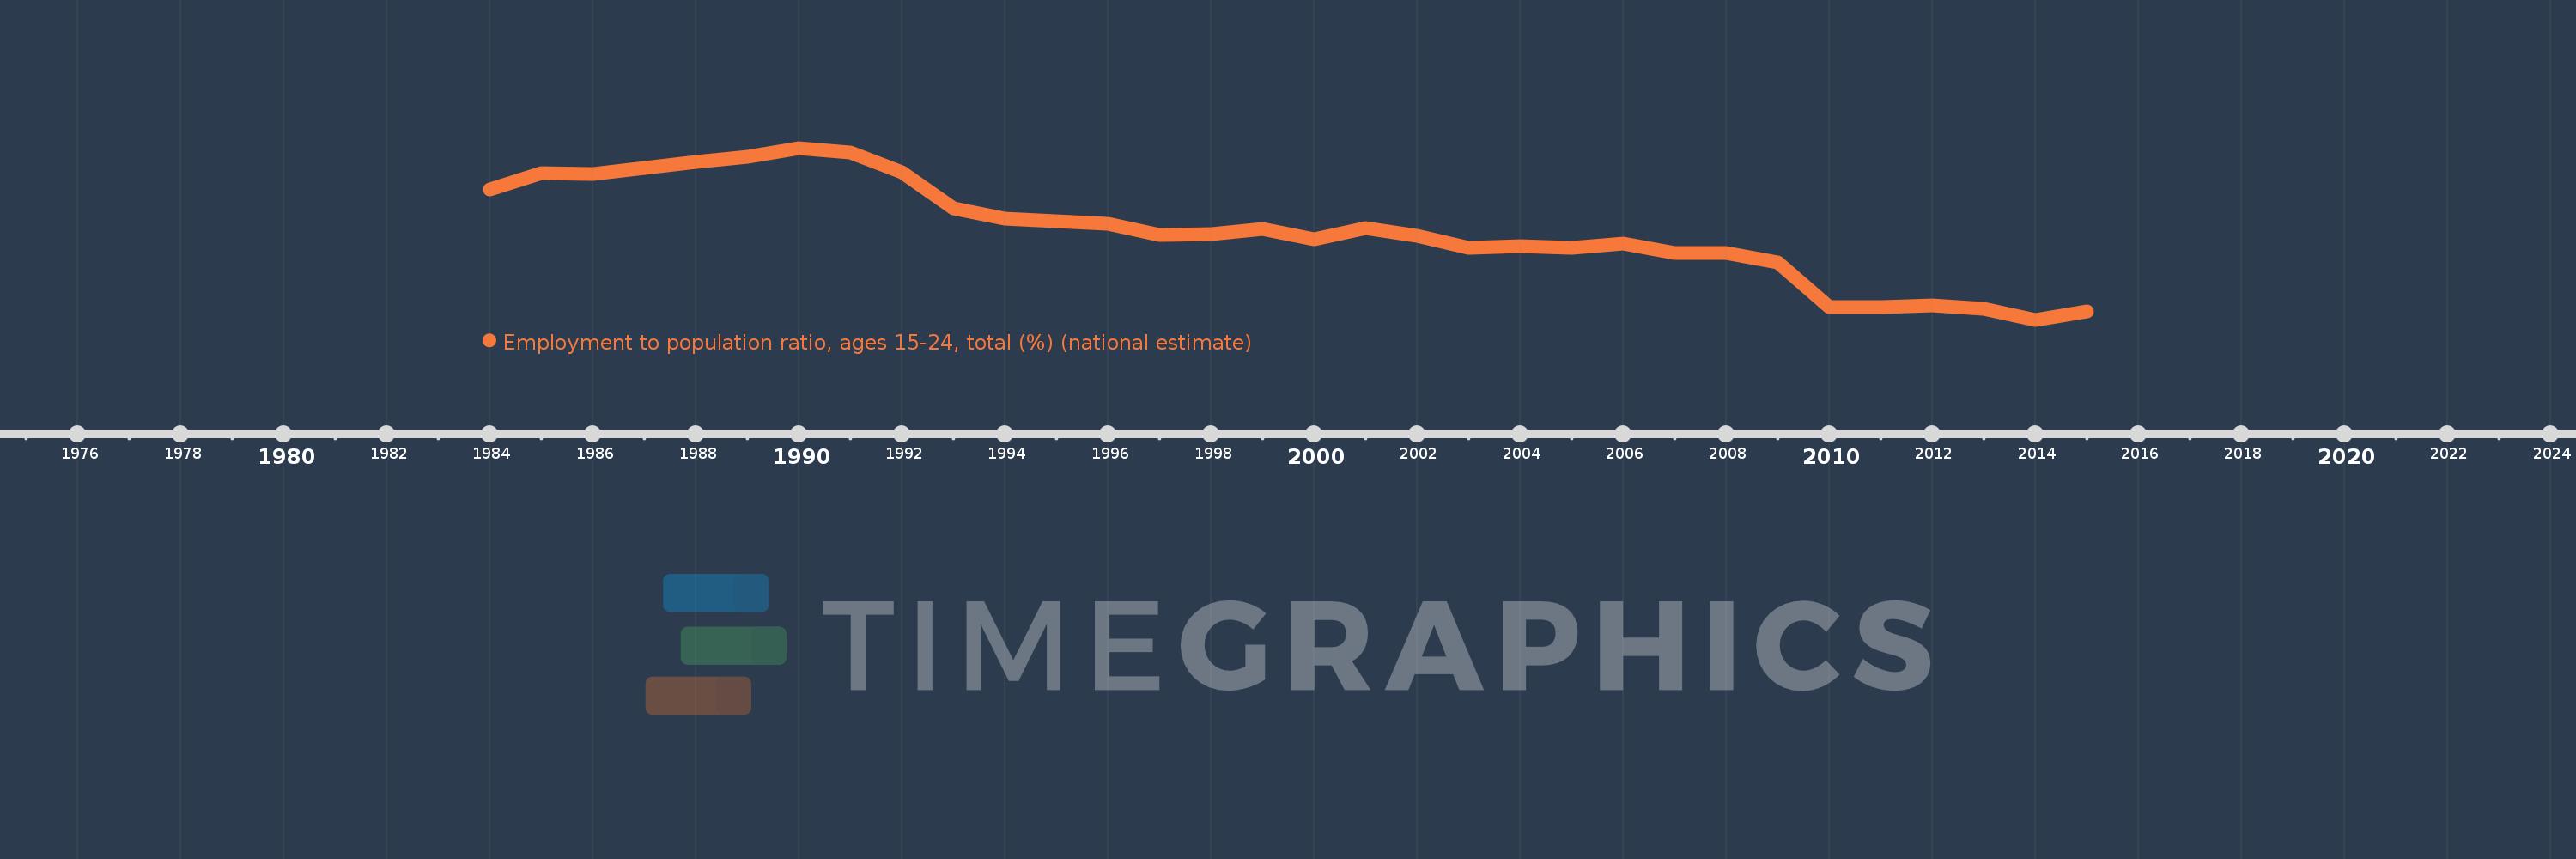
Employment to population ratio, ages 15-24, total (%) (national estimate)
2015,2014,2013,2012,2011,2010,2009,2008,2007,2006,2005,2004,2003,2002,2001,2000,1999,1998,1997,1996,1995,1994,1993,1992,1991,1990,1989,1988,1987,1986,1985,1984
This statistics in other country:
Timeline:
This timeline shows a graph from 1984 to 2015 of High income. No data until 1983. Number of actual observations by date: 32.
Source name:
World Development Indicators
Source organization:
International Labour Organization, Key Indicators of the Labour Market database.
Categories, topics:
Social Protection & Labor
Last updated:
apr 23, 2017
Indicators value changes by year
Minimum:
38.579
jan 1, 2014
Maximum:
49.865
jan 1, 1990
At the date of observation
Value
Absolute change
Change from previous value
jan 1, 1984
47.115
+47.115
0.0%
jan 1, 1985
48.186
+1.07
2.27%
jan 1, 1986
48.136
-0.049
-0.1%
jan 1, 1987
48.555
+0.419
0.87%
jan 1, 1988
48.919
+0.364
0.75%
jan 1, 1989
49.294
+0.375
0.77%
jan 1, 1990
49.865
+0.571
1.16%
jan 1, 1991
49.557
-0.308
-0.62%
jan 1, 1992
48.251
-1.306
-2.64%
jan 1, 1993
45.889
-2.361
-4.89%
jan 1, 1994
45.204
-0.686
-1.49%
jan 1, 1995
45.05
-0.153
-0.34%
jan 1, 1996
44.856
-0.195
-0.43%
jan 1, 1997
44.148
-0.708
-1.58%
jan 1, 1998
44.214
+0.065
0.15%
jan 1, 1999
44.565
+0.351
0.79%
jan 1, 2000
43.873
-0.692
-1.55%
jan 1, 2001
44.579
+0.706
1.61%
jan 1, 2002
44.109
-0.47
-1.05%
jan 1, 2003
43.297
-0.812
-1.84%
jan 1, 2004
43.419
+0.122
0.28%
jan 1, 2005
43.326
-0.093
-0.21%
jan 1, 2006
43.565
+0.239
0.55%
jan 1, 2007
42.958
-0.607
-1.39%
jan 1, 2008
42.946
-0.012
-0.03%
jan 1, 2009
42.348
-0.598
-1.39%
jan 1, 2010
39.429
-2.919
-6.89%
jan 1, 2011
39.384
-0.045
-0.11%
jan 1, 2012
39.546
+0.162
0.41%
jan 1, 2013
39.289
-0.258
-0.65%
jan 1, 2014
38.579
-0.71
-1.81%
jan 1, 2015
39.137
+0.558
1.45%
Ranking of countries by current statistics by years


Comments: