29
/
en
AIzaSyAYiBZKx7MnpbEhh9jyipgxe19OcubqV5w
April 1, 2024
91049
Brazil
BRA
true
2
1
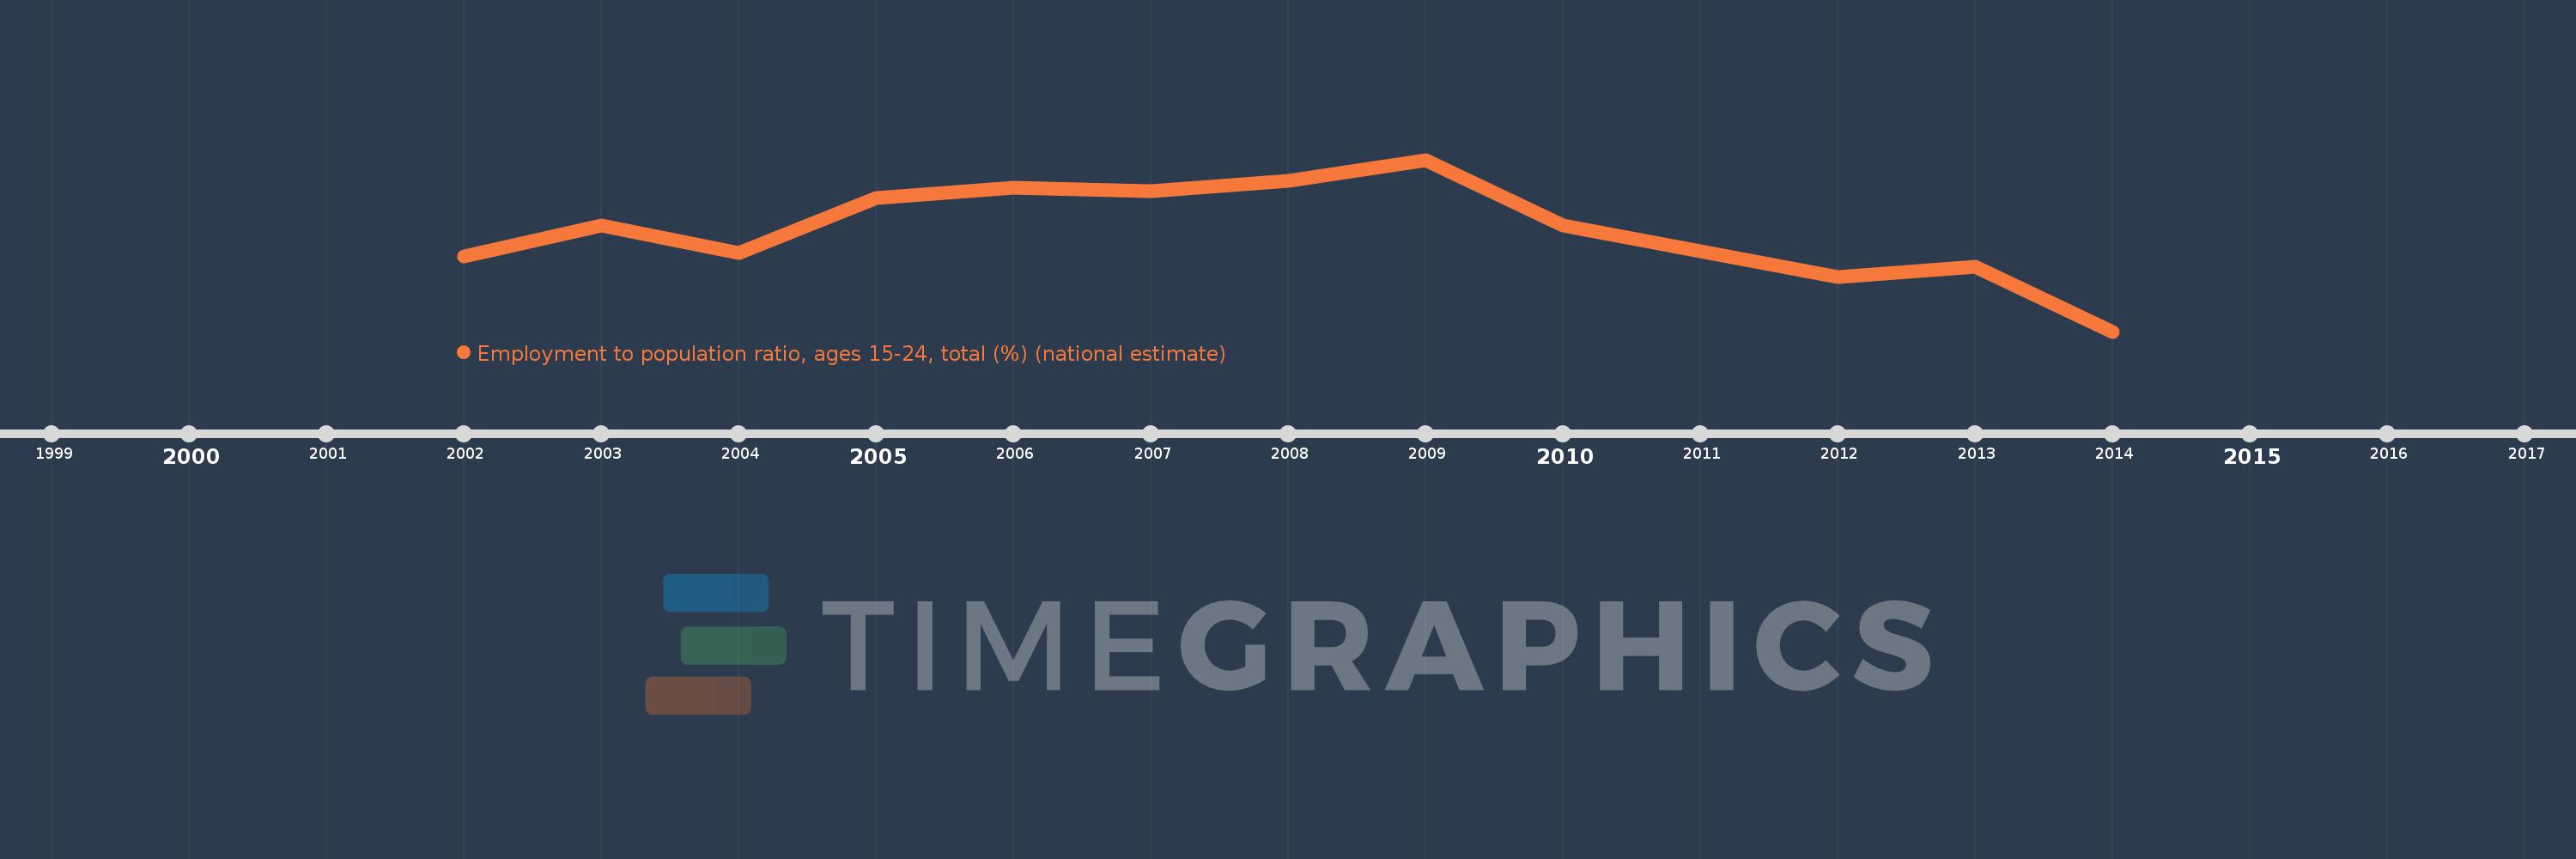
Employment to population ratio, ages 15-24, total (%) (national estimate)
2014,2013,2012,2010,2009,2008,2007,2006,2005,2004,2003,2002
This statistics in other country:
Timeline:
This timeline shows a graph from 2002 to 2014 of Brazil. No data until 2001. Number of actual observations by date: 12.
Source name:
World Development Indicators
Source organization:
International Labour Organization, Key Indicators of the Labour Market database.
Categories, topics:
Social Protection & Labor
Last updated:
apr 23, 2017
Indicators value changes by year
At the date of observation
Value
Absolute change
Change from previous value
jan 1, 2002
50.7
+50.7
0.0%
jan 1, 2003
51.6
+0.9
1.78%
jan 1, 2004
50.8
-0.8
-1.55%
jan 1, 2005
52.4
+1.6
3.15%
jan 1, 2006
52.7
+0.3
0.57%
jan 1, 2007
52.6
-0.1
-0.19%
jan 1, 2008
52.9
+0.3
0.57%
jan 1, 2009
53.5
+0.6
1.13%
jan 1, 2010
51.6
-1.9
-3.55%
jan 1, 2012
50.1
-1.5
-2.91%
jan 1, 2013
50.4
+0.3
0.6%
jan 1, 2014
48.5
-1.9
-3.77%
Ranking of countries by current statistics by years


Comments: