29
/
en
AIzaSyAYiBZKx7MnpbEhh9jyipgxe19OcubqV5w
April 1, 2024
52548
OECD members
OED
false
2
1
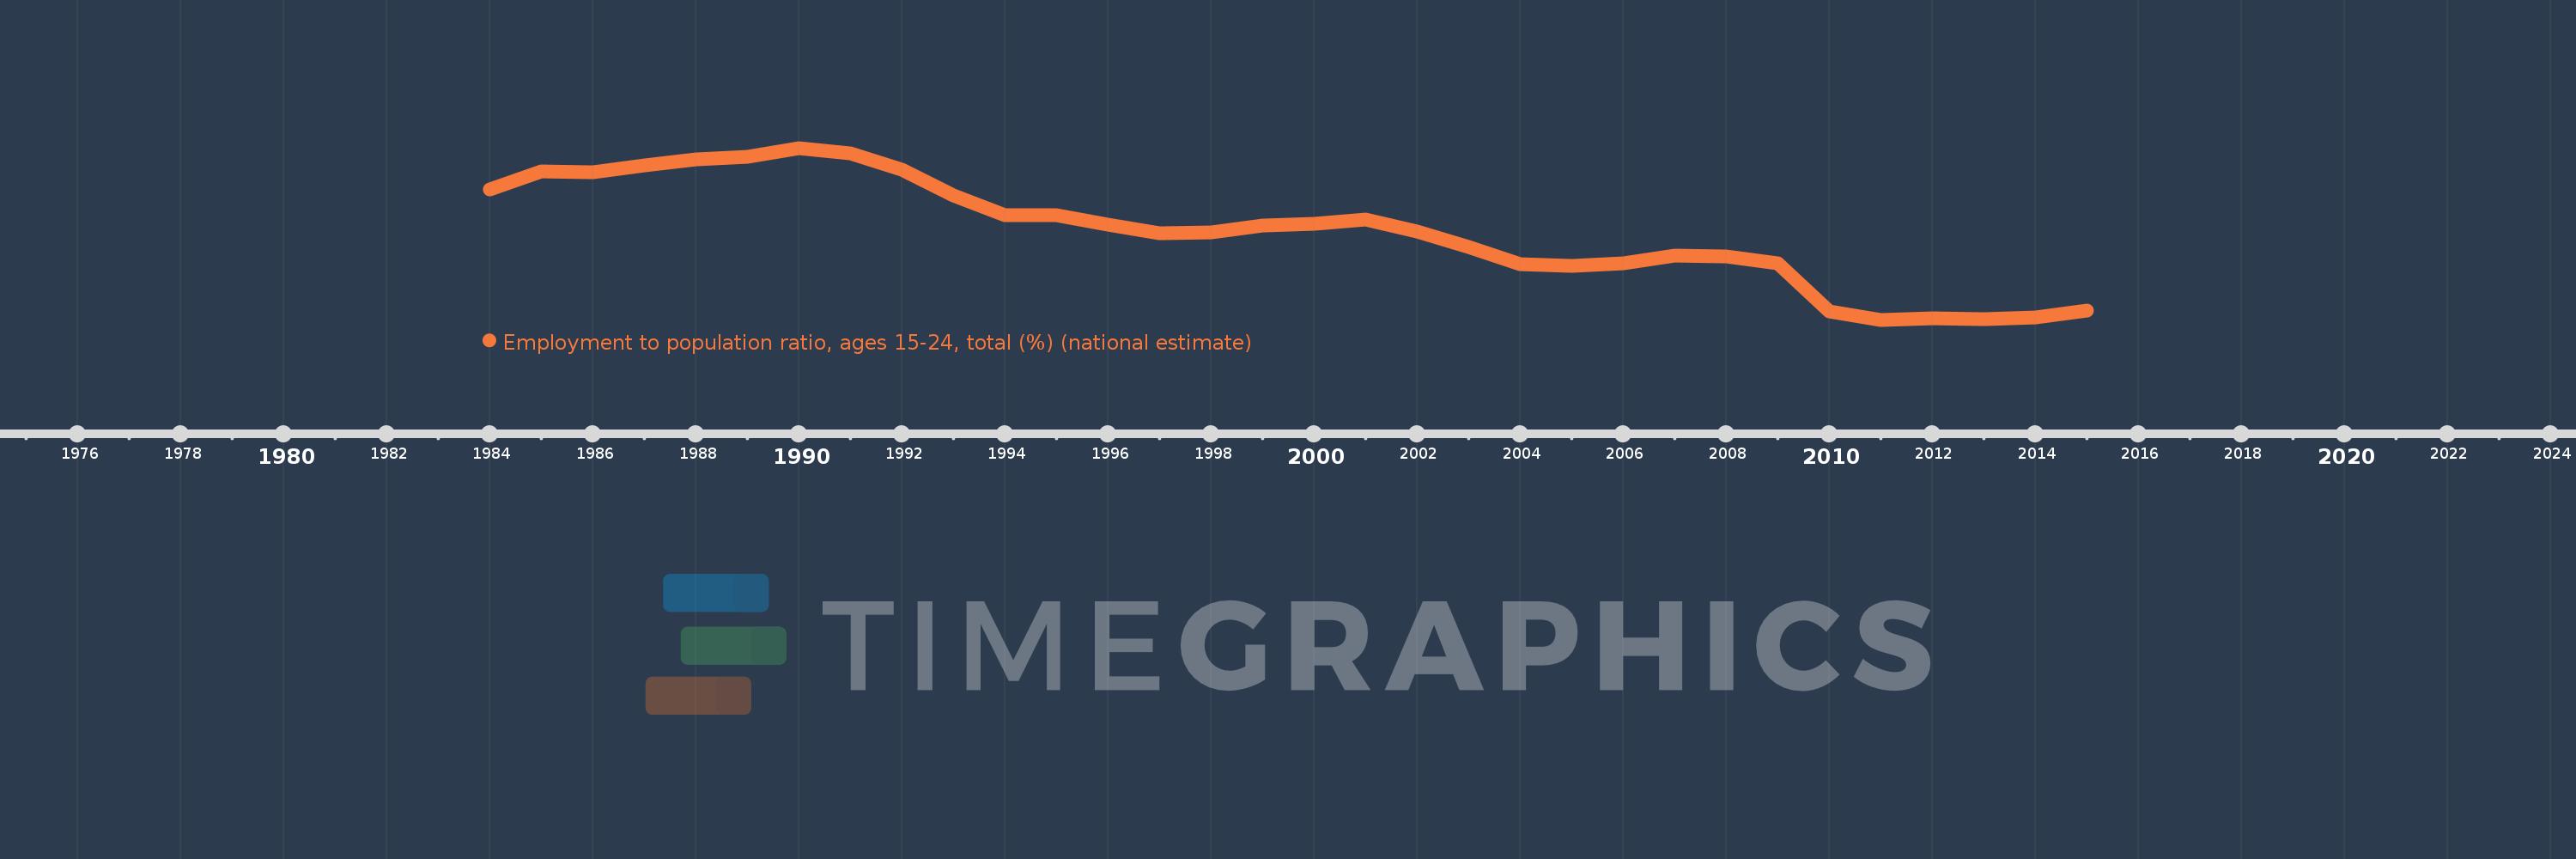
Employment to population ratio, ages 15-24, total (%) (national estimate)
2015,2014,2013,2012,2011,2010,2009,2008,2007,2006,2005,2004,2003,2002,2001,2000,1999,1998,1997,1996,1995,1994,1993,1992,1991,1990,1989,1988,1987,1986,1985,1984
This statistics in other country:
Timeline:
This timeline shows a graph from 1984 to 2015 of OECD members. No data until 1983. Number of actual observations by date: 32.
Source name:
World Development Indicators
Source organization:
International Labour Organization, Key Indicators of the Labour Market database.
Categories, topics:
Social Protection & Labor
Last updated:
apr 23, 2017
Indicators value changes by year
Minimum:
39.328
jan 1, 2011
Maximum:
49.585
jan 1, 1990
At the date of observation
Value
Absolute change
Change from previous value
jan 1, 1984
47.115
+47.115
0.0%
jan 1, 1985
48.186
+1.07
2.27%
jan 1, 1986
48.136
-0.049
-0.1%
jan 1, 1987
48.555
+0.419
0.87%
jan 1, 1988
48.919
+0.364
0.75%
jan 1, 1989
49.071
+0.152
0.31%
jan 1, 1990
49.585
+0.514
1.05%
jan 1, 1991
49.278
-0.308
-0.62%
jan 1, 1992
48.286
-0.992
-2.01%
jan 1, 1993
46.772
-1.514
-3.13%
jan 1, 1994
45.591
-1.181
-2.52%
jan 1, 1995
45.552
-0.039
-0.09%
jan 1, 1996
44.999
-0.553
-1.21%
jan 1, 1997
44.498
-0.5
-1.11%
jan 1, 1998
44.545
+0.047
0.11%
jan 1, 1999
44.934
+0.389
0.87%
jan 1, 2000
45.031
+0.097
0.22%
jan 1, 2001
45.298
+0.267
0.59%
jan 1, 2002
44.618
-0.68
-1.5%
jan 1, 2003
43.648
-0.97
-2.17%
jan 1, 2004
42.649
-0.999
-2.29%
jan 1, 2005
42.564
-0.085
-0.2%
jan 1, 2006
42.701
+0.137
0.32%
jan 1, 2007
43.17
+0.469
1.1%
jan 1, 2008
43.119
-0.051
-0.12%
jan 1, 2009
42.672
-0.448
-1.04%
jan 1, 2010
39.823
-2.848
-6.67%
jan 1, 2011
39.328
-0.495
-1.24%
jan 1, 2012
39.397
+0.069
0.18%
jan 1, 2013
39.352
-0.044
-0.11%
jan 1, 2014
39.448
+0.096
0.24%
jan 1, 2015
39.895
+0.447
1.13%
Ranking of countries by current statistics by years


Comments: