29
/
en
AIzaSyAYiBZKx7MnpbEhh9jyipgxe19OcubqV5w
April 1, 2024
195454
Mexico
MEX
true
2
1
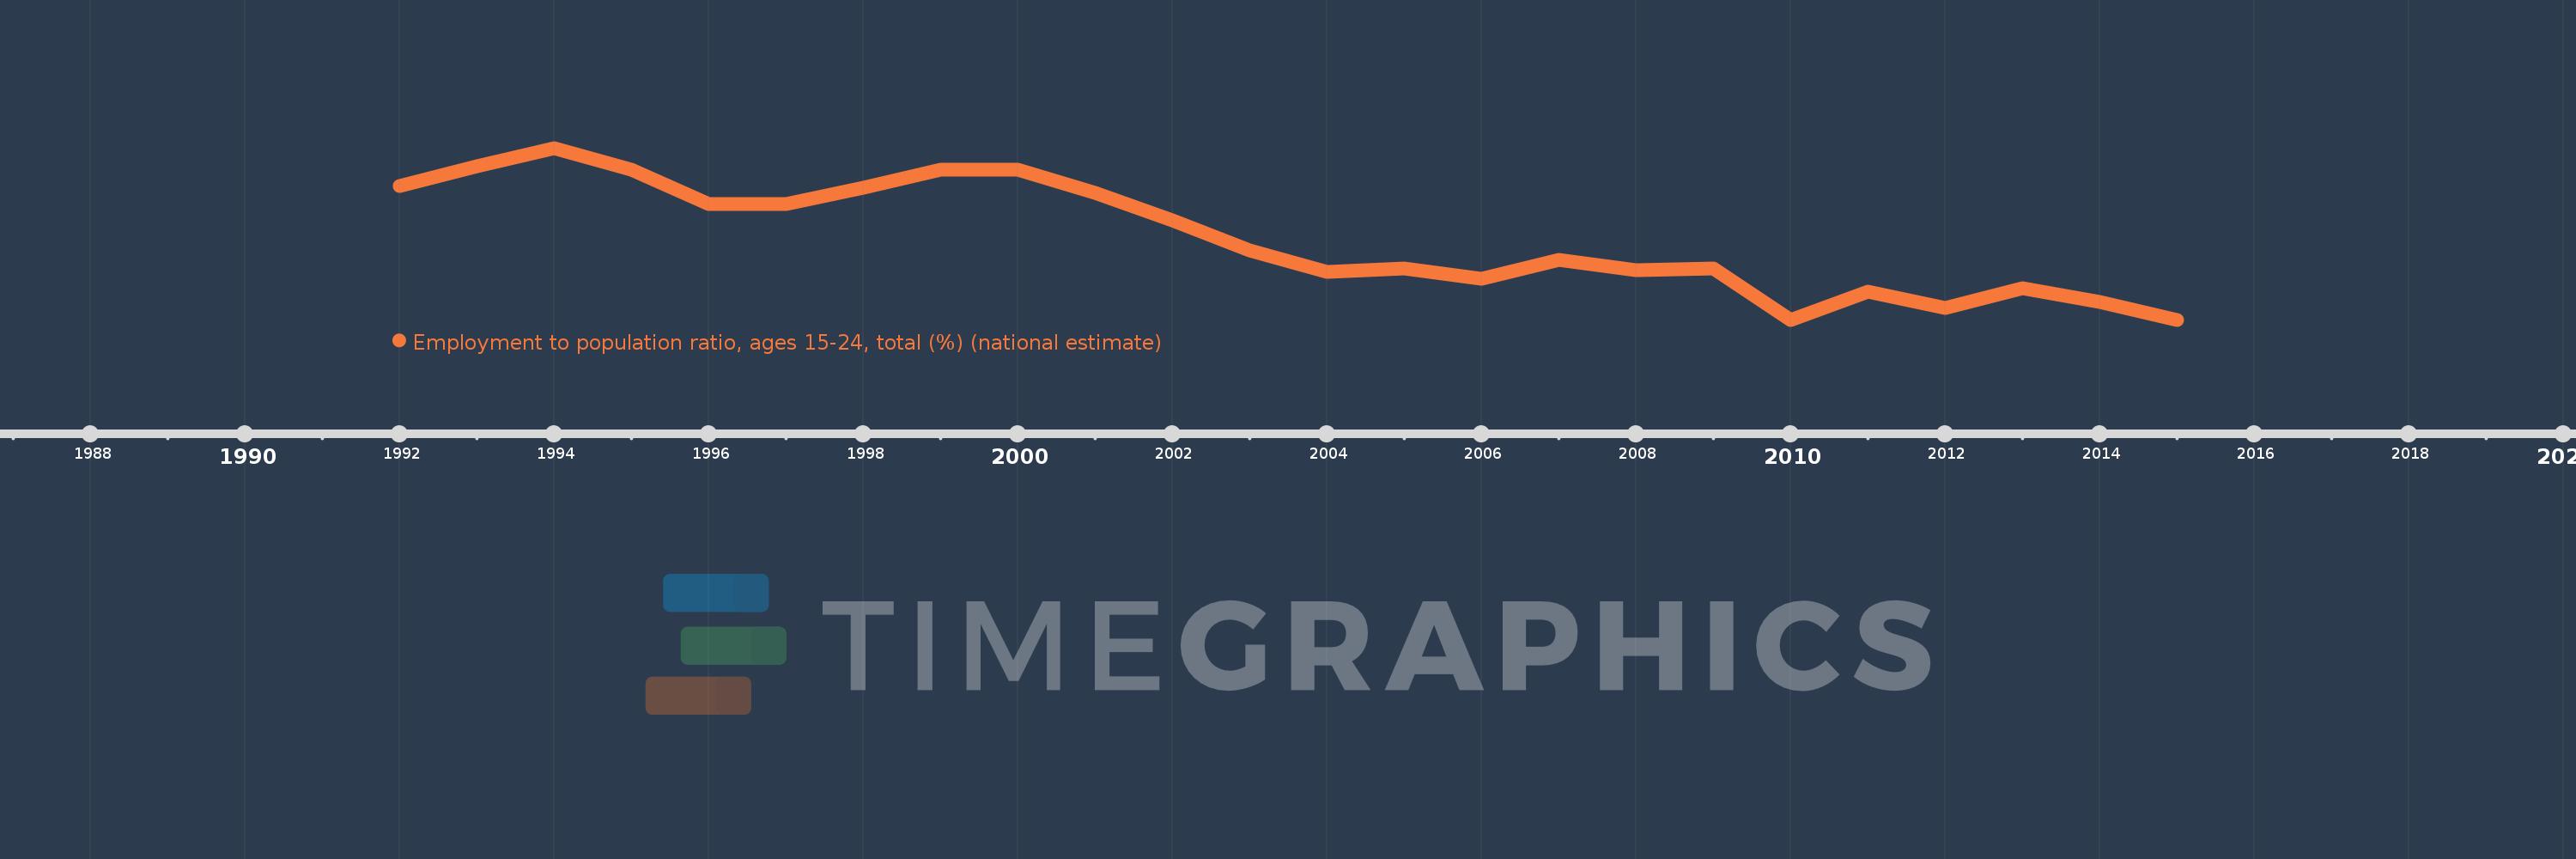
Employment to population ratio, ages 15-24, total (%) (national estimate)
2015,2014,2013,2012,2011,2010,2009,2008,2007,2006,2005,2004,2003,2002,2001,2000,1999,1998,1997,1996,1995,1994,1993,1992
This statistics in other country:
Timeline:
This timeline shows a graph from 1992 to 2015 of Mexico. No data until 1991. Number of actual observations by date: 24.
Source name:
World Development Indicators
Source organization:
International Labour Organization, Key Indicators of the Labour Market database.
Categories, topics:
Social Protection & Labor
Last updated:
apr 23, 2017
Indicators value changes by year
At the date of observation
Value
Absolute change
Change from previous value
jan 1, 1992
49.3
+49.3
0.0%
jan 1, 1993
50.5
+1.2
2.43%
jan 1, 1994
51.6
+1.1
2.18%
jan 1, 1995
50.3
-1.3
-2.52%
jan 1, 1996
48.2
-2.1
-4.17%
jan 1, 1998
49.2
+1.0
2.07%
jan 1, 1999
50.3
+1.1
2.24%
jan 1, 2001
48.9
-1.4
-2.78%
jan 1, 2002
47.2
-1.7
-3.48%
jan 1, 2003
45.4
-1.8
-3.81%
jan 1, 2004
44.1
-1.3
-2.86%
jan 1, 2005
44.3
+0.2
0.45%
jan 1, 2006
43.7
-0.6
-1.35%
jan 1, 2007
44.8
+1.1
2.52%
jan 1, 2008
44.2
-0.6
-1.34%
jan 1, 2009
44.3
+0.1
0.23%
jan 1, 2010
41.2
-3.1
-7.0%
jan 1, 2011
42.9
+1.7
4.13%
jan 1, 2012
41.9
-1.0
-2.33%
jan 1, 2013
43.1
+1.2
2.86%
jan 1, 2014
42.3
-0.8
-1.86%
jan 1, 2015
41.2
-1.1
-2.6%
Ranking of countries by current statistics by years


Comments: