29
/
en
AIzaSyAYiBZKx7MnpbEhh9jyipgxe19OcubqV5w
April 1, 2024
25634
Central Europe and the Baltics
CEB
false
2
1
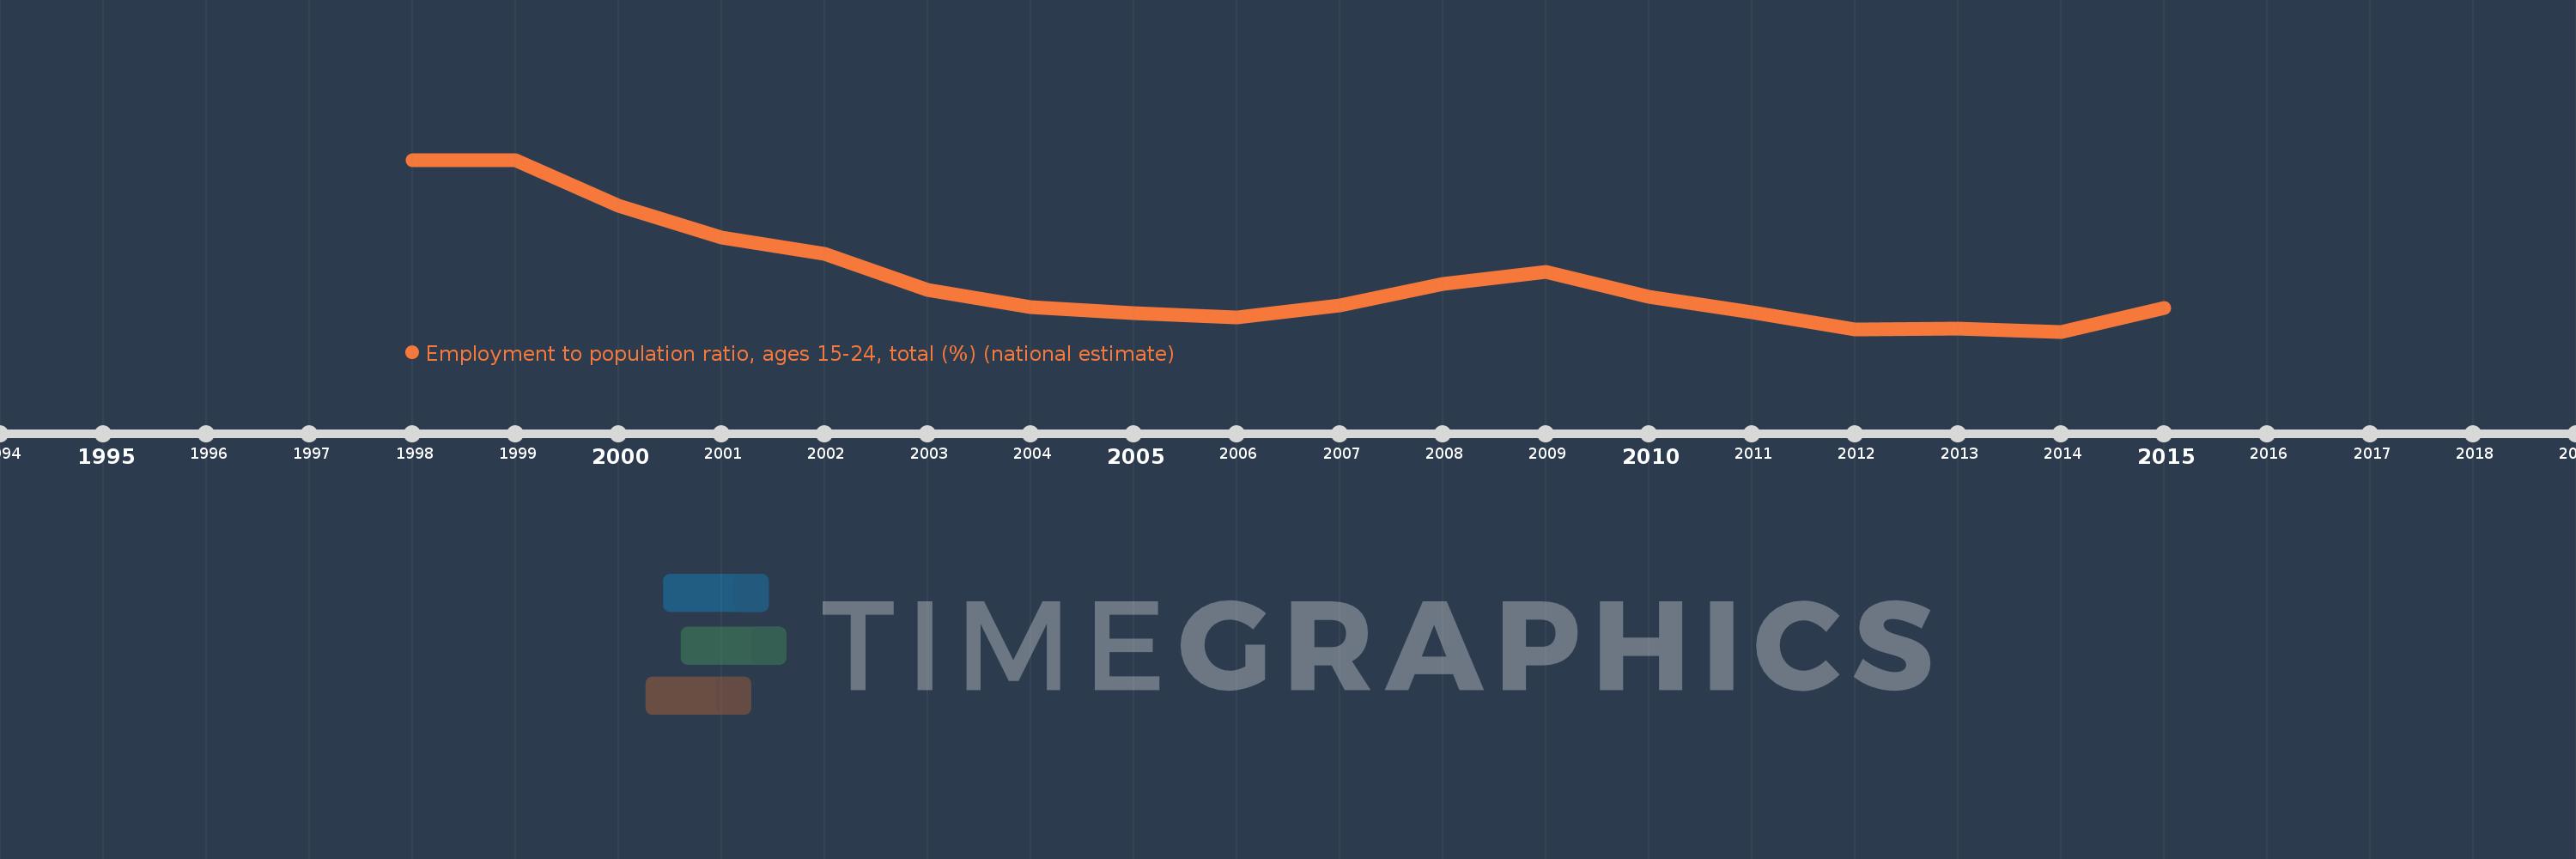
Employment to population ratio, ages 15-24, total (%) (national estimate)
2015,2014,2013,2012,2011,2010,2009,2008,2007,2006,2005,2004,2003,2002,2001,2000,1999,1998
This statistics in other country:
Timeline:
This timeline shows a graph from 1998 to 2015 of Central Europe and the Baltics. No data until 1997. Number of actual observations by date: 18.
Source name:
World Development Indicators
Source organization:
International Labour Organization, Key Indicators of the Labour Market database.
Categories, topics:
Social Protection & Labor
Last updated:
apr 23, 2017
Indicators value changes by year
Minimum:
23.208
jan 1, 2014
Maximum:
33.107
jan 1, 1998
At the date of observation
Value
Absolute change
Change from previous value
jan 1, 1998
33.107
+33.107
0.0%
jan 1, 1999
33.072
-0.035
-0.11%
jan 1, 2000
30.467
-2.605
-7.88%
jan 1, 2001
28.641
-1.826
-5.99%
jan 1, 2002
27.709
-0.932
-3.26%
jan 1, 2003
25.633
-2.075
-7.49%
jan 1, 2004
24.611
-1.023
-3.99%
jan 1, 2005
24.295
-0.316
-1.28%
jan 1, 2006
24.048
-0.247
-1.02%
jan 1, 2007
24.732
+0.685
2.85%
jan 1, 2008
25.977
+1.245
5.03%
jan 1, 2009
26.648
+0.671
2.58%
jan 1, 2010
25.209
-1.439
-5.4%
jan 1, 2011
24.32
-0.889
-3.53%
jan 1, 2012
23.353
-0.967
-3.98%
jan 1, 2013
23.375
+0.022
0.09%
jan 1, 2014
23.208
-0.167
-0.71%
jan 1, 2015
24.55
+1.341
5.78%
Ranking of countries by current statistics by years


Comments: