29
/
en
AIzaSyAYiBZKx7MnpbEhh9jyipgxe19OcubqV5w
April 1, 2024
35315
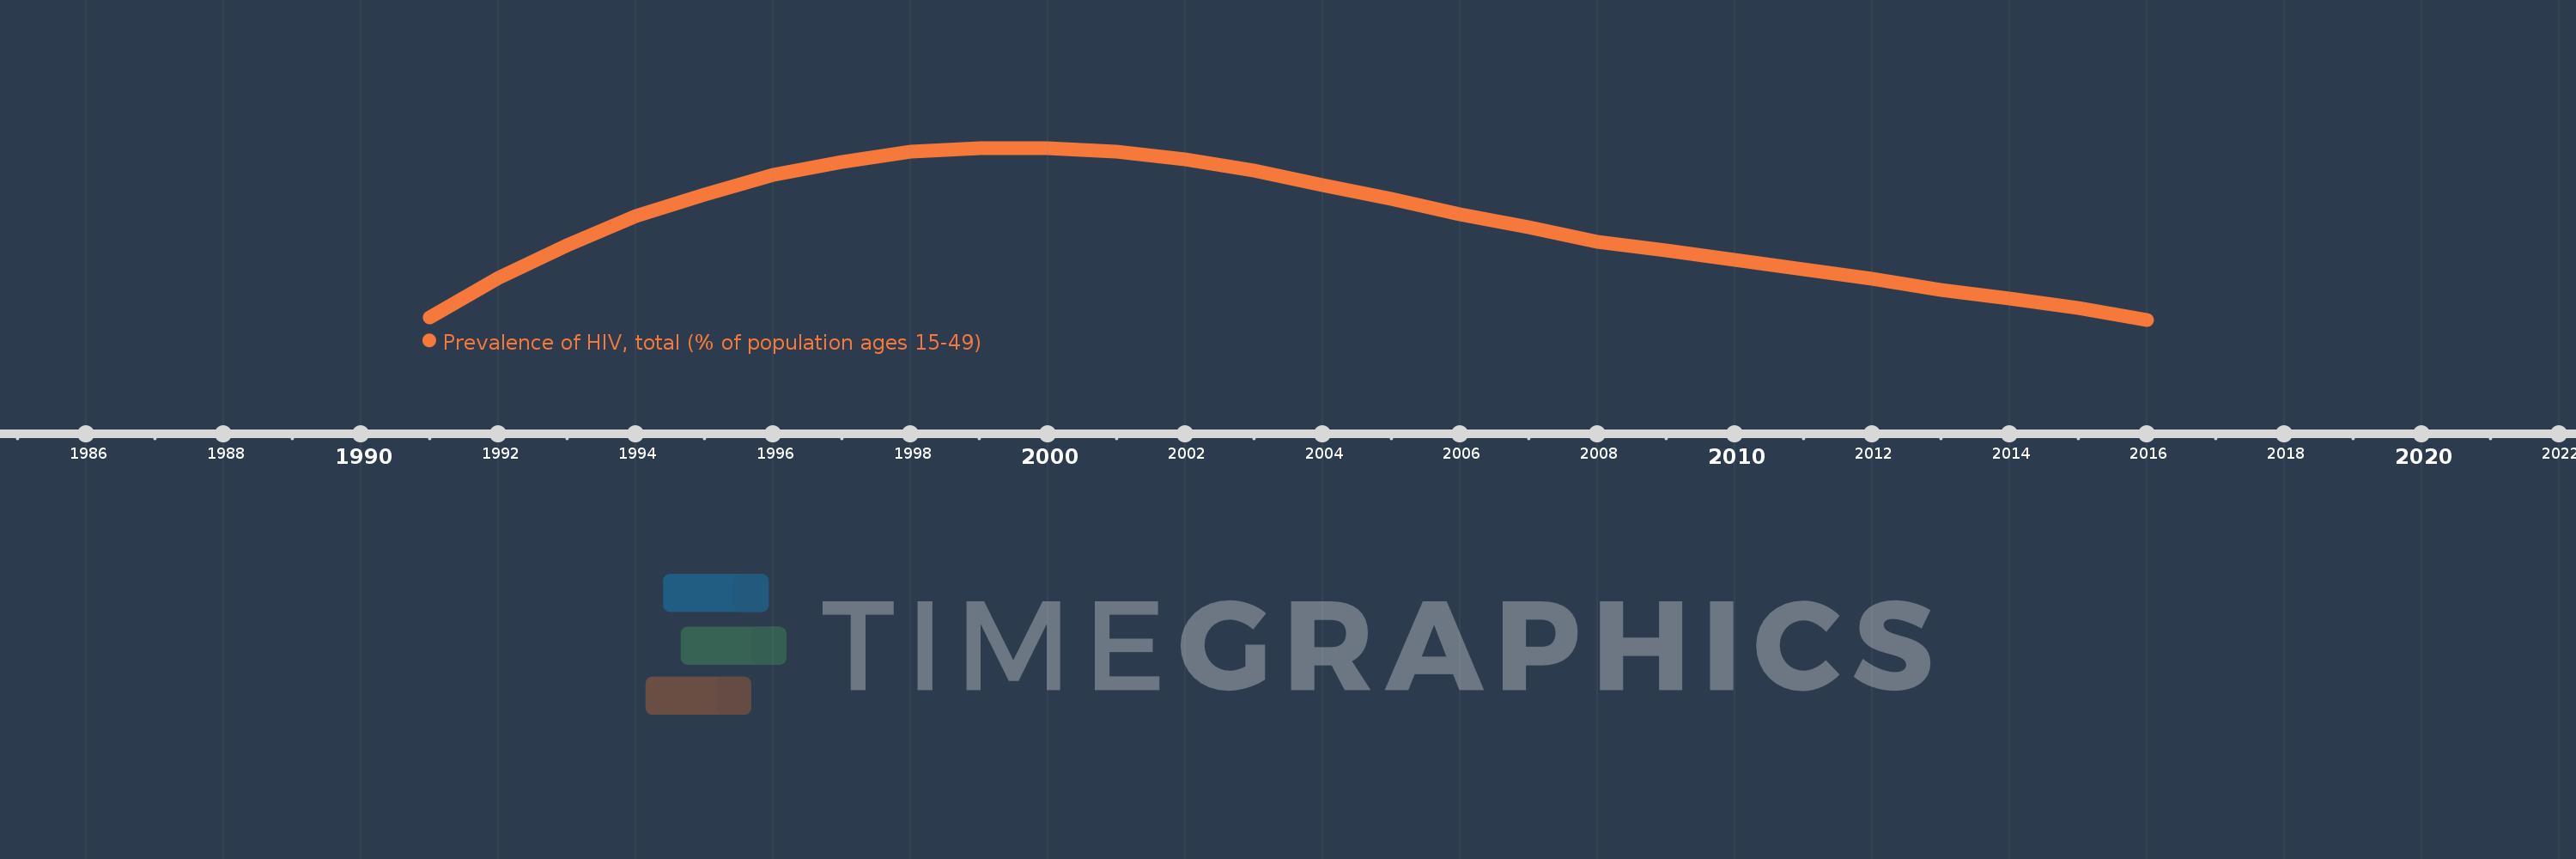
Heavily indebted poor countries (HIPC)
HPC
false
2
1
Prevalence of HIV, total (% of population ages 15-49)
2016,2015,2014,2013,2012,2011,2010,2009,2008,2007,2006,2005,2004,2003,2002,2001,2000,1999,1998,1997,1996,1995,1994,1993,1992,1991
This statistics in other country:
Timeline:
This timeline shows a graph from 1991 to 2016 of Heavily indebted poor countries (HIPC). No data until 1990. Number of actual observations by date: 26.
Source name:
World Development Indicators
Source organization:
UNAIDS estimates.
Categories, topics:
Health, Aid Effectiveness
Last updated:
apr 23, 2017
Indicators value changes by year
At the date of observation
Value
Absolute change
Change from previous value
jan 1, 1991
2.822
+2.822
0.0%
jan 1, 1992
3.091
+0.269
9.53%
jan 1, 1993
3.31
+0.218
7.07%
jan 1, 1994
3.513
+0.203
6.13%
jan 1, 1995
3.659
+0.146
4.15%
jan 1, 1996
3.792
+0.133
3.65%
jan 1, 1997
3.876
+0.084
2.22%
jan 1, 1998
3.95
+0.074
1.9%
jan 1, 1999
3.973
+0.023
0.58%
jan 1, 2000
3.974
+0.001
0.02%
jan 1, 2001
3.949
-0.025
-0.63%
jan 1, 2002
3.895
-0.054
-1.37%
jan 1, 2003
3.818
-0.077
-1.97%
jan 1, 2004
3.719
-0.098
-2.58%
jan 1, 2005
3.628
-0.092
-2.47%
jan 1, 2006
3.523
-0.105
-2.88%
jan 1, 2007
3.433
-0.09
-2.55%
jan 1, 2008
3.337
-0.096
-2.8%
jan 1, 2009
3.278
-0.059
-1.76%
jan 1, 2010
3.213
-0.065
-1.99%
jan 1, 2011
3.147
-0.066
-2.04%
jan 1, 2012
3.081
-0.067
-2.12%
jan 1, 2013
3.005
-0.075
-2.45%
jan 1, 2014
2.946
-0.06
-1.98%
jan 1, 2015
2.884
-0.062
-2.1%
jan 1, 2016
2.804
-0.08
-2.78%
Ranking of countries by current statistics by years


Comments: