29
/
en
AIzaSyAYiBZKx7MnpbEhh9jyipgxe19OcubqV5w
April 1, 2024
44596
Least developed countries: UN classification
LDC
false
2
1
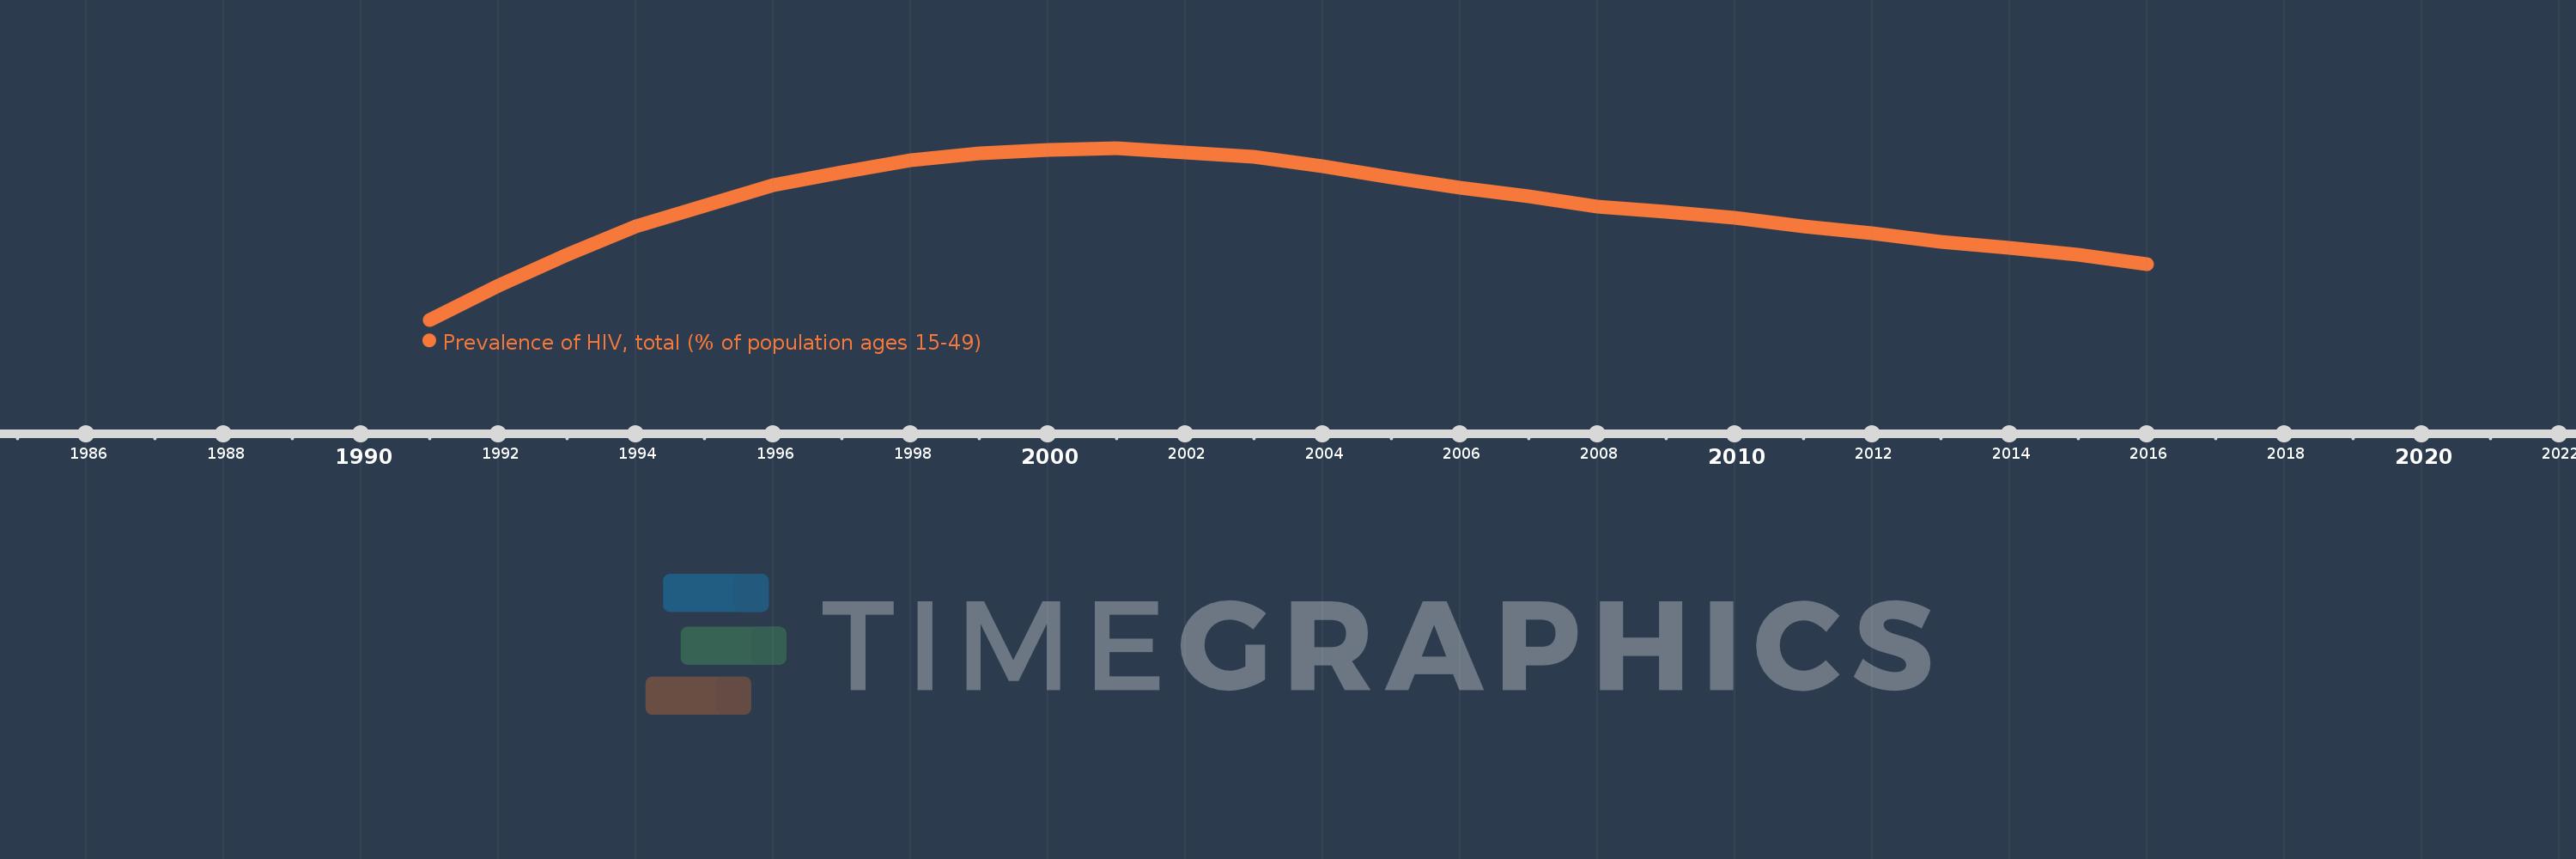
Prevalence of HIV, total (% of population ages 15-49)
2016,2015,2014,2013,2012,2011,2010,2009,2008,2007,2006,2005,2004,2003,2002,2001,2000,1999,1998,1997,1996,1995,1994,1993,1992,1991
This statistics in other country:
Timeline:
This timeline shows a graph from 1991 to 2016 of Least developed countries: UN classification. No data until 1990. Number of actual observations by date: 26.
Source name:
World Development Indicators
Source organization:
UNAIDS estimates.
Categories, topics:
Health, Aid Effectiveness
Last updated:
apr 23, 2017
Indicators value changes by year
At the date of observation
Value
Absolute change
Change from previous value
jan 1, 1992
1.849
+0.148
8.73%
jan 1, 1993
1.986
+0.137
7.41%
jan 1, 1994
2.113
+0.127
6.38%
jan 1, 1995
2.205
+0.092
4.38%
jan 1, 1996
2.296
+0.091
4.14%
jan 1, 1997
2.351
+0.055
2.39%
jan 1, 1998
2.406
+0.054
2.32%
jan 1, 1999
2.434
+0.028
1.15%
jan 1, 2000
2.451
+0.017
0.7%
jan 1, 2001
2.459
+0.008
0.33%
jan 1, 2002
2.438
-0.021
-0.84%
jan 1, 2003
2.42
-0.018
-0.73%
jan 1, 2004
2.377
-0.043
-1.78%
jan 1, 2005
2.33
-0.047
-1.99%
jan 1, 2006
2.282
-0.047
-2.03%
jan 1, 2007
2.246
-0.037
-1.62%
jan 1, 2008
2.199
-0.047
-2.09%
jan 1, 2009
2.177
-0.021
-0.97%
jan 1, 2010
2.152
-0.026
-1.18%
jan 1, 2011
2.114
-0.038
-1.76%
jan 1, 2012
2.081
-0.032
-1.54%
jan 1, 2013
2.044
-0.037
-1.8%
jan 1, 2014
2.019
-0.025
-1.24%
jan 1, 2015
1.986
-0.033
-1.64%
jan 1, 2016
1.945
-0.041
-2.05%
Ranking of countries by current statistics by years


Comments: