29
/
en
AIzaSyAYiBZKx7MnpbEhh9jyipgxe19OcubqV5w
April 1, 2024
46588
Low income
LIC
false
2
1
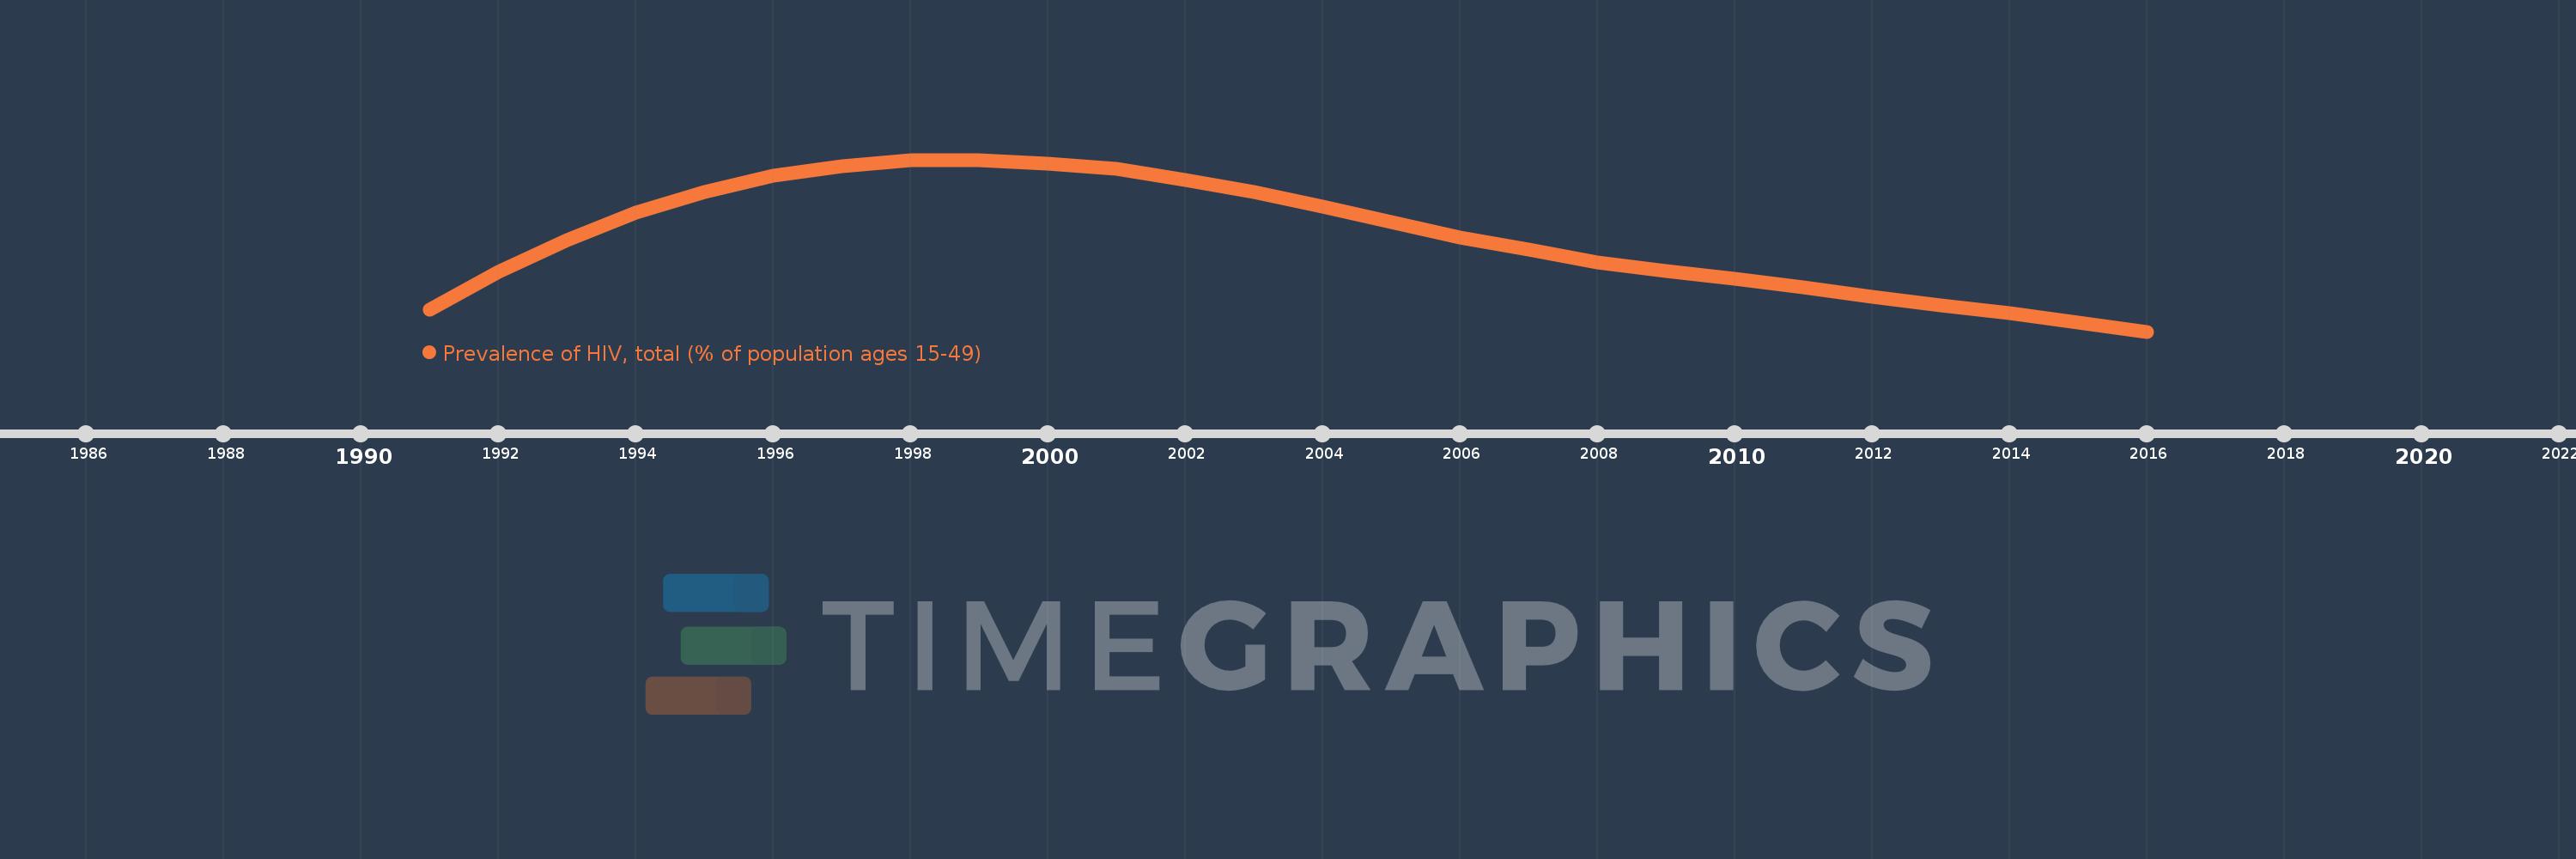
Prevalence of HIV, total (% of population ages 15-49)
2016,2015,2014,2013,2012,2011,2010,2009,2008,2007,2006,2005,2004,2003,2002,2001,2000,1999,1998,1997,1996,1995,1994,1993,1992,1991
This statistics in other country:
Timeline:
This timeline shows a graph from 1991 to 2016 of Low income. No data until 1990. Number of actual observations by date: 26.
Source name:
World Development Indicators
Source organization:
UNAIDS estimates.
Categories, topics:
Health, Aid Effectiveness
Last updated:
apr 23, 2017
Indicators value changes by year
At the date of observation
Value
Absolute change
Change from previous value
jan 1, 1991
3.256
+3.256
0.0%
jan 1, 1992
3.611
+0.355
10.9%
jan 1, 1993
3.913
+0.302
8.36%
jan 1, 1994
4.175
+0.263
6.71%
jan 1, 1995
4.371
+0.195
4.68%
jan 1, 1996
4.521
+0.151
3.44%
jan 1, 1997
4.615
+0.093
2.06%
jan 1, 1998
4.672
+0.057
1.23%
jan 1, 1999
4.674
+0.002
0.05%
jan 1, 2000
4.64
-0.033
-0.71%
jan 1, 2001
4.585
-0.056
-1.2%
jan 1, 2002
4.486
-0.099
-2.17%
jan 1, 2003
4.373
-0.113
-2.51%
jan 1, 2004
4.232
-0.141
-3.23%
jan 1, 2005
4.081
-0.151
-3.57%
jan 1, 2006
3.939
-0.142
-3.47%
jan 1, 2007
3.821
-0.118
-2.99%
jan 1, 2008
3.7
-0.121
-3.18%
jan 1, 2009
3.621
-0.079
-2.14%
jan 1, 2010
3.545
-0.076
-2.09%
jan 1, 2011
3.466
-0.079
-2.23%
jan 1, 2012
3.379
-0.087
-2.51%
jan 1, 2013
3.294
-0.085
-2.51%
jan 1, 2014
3.225
-0.069
-2.11%
jan 1, 2015
3.136
-0.089
-2.75%
jan 1, 2016
3.048
-0.089
-2.82%
Ranking of countries by current statistics by years


Comments: