29
/
en
AIzaSyAYiBZKx7MnpbEhh9jyipgxe19OcubqV5w
April 1, 2024
120373
Djibouti
DJI
true
2
1
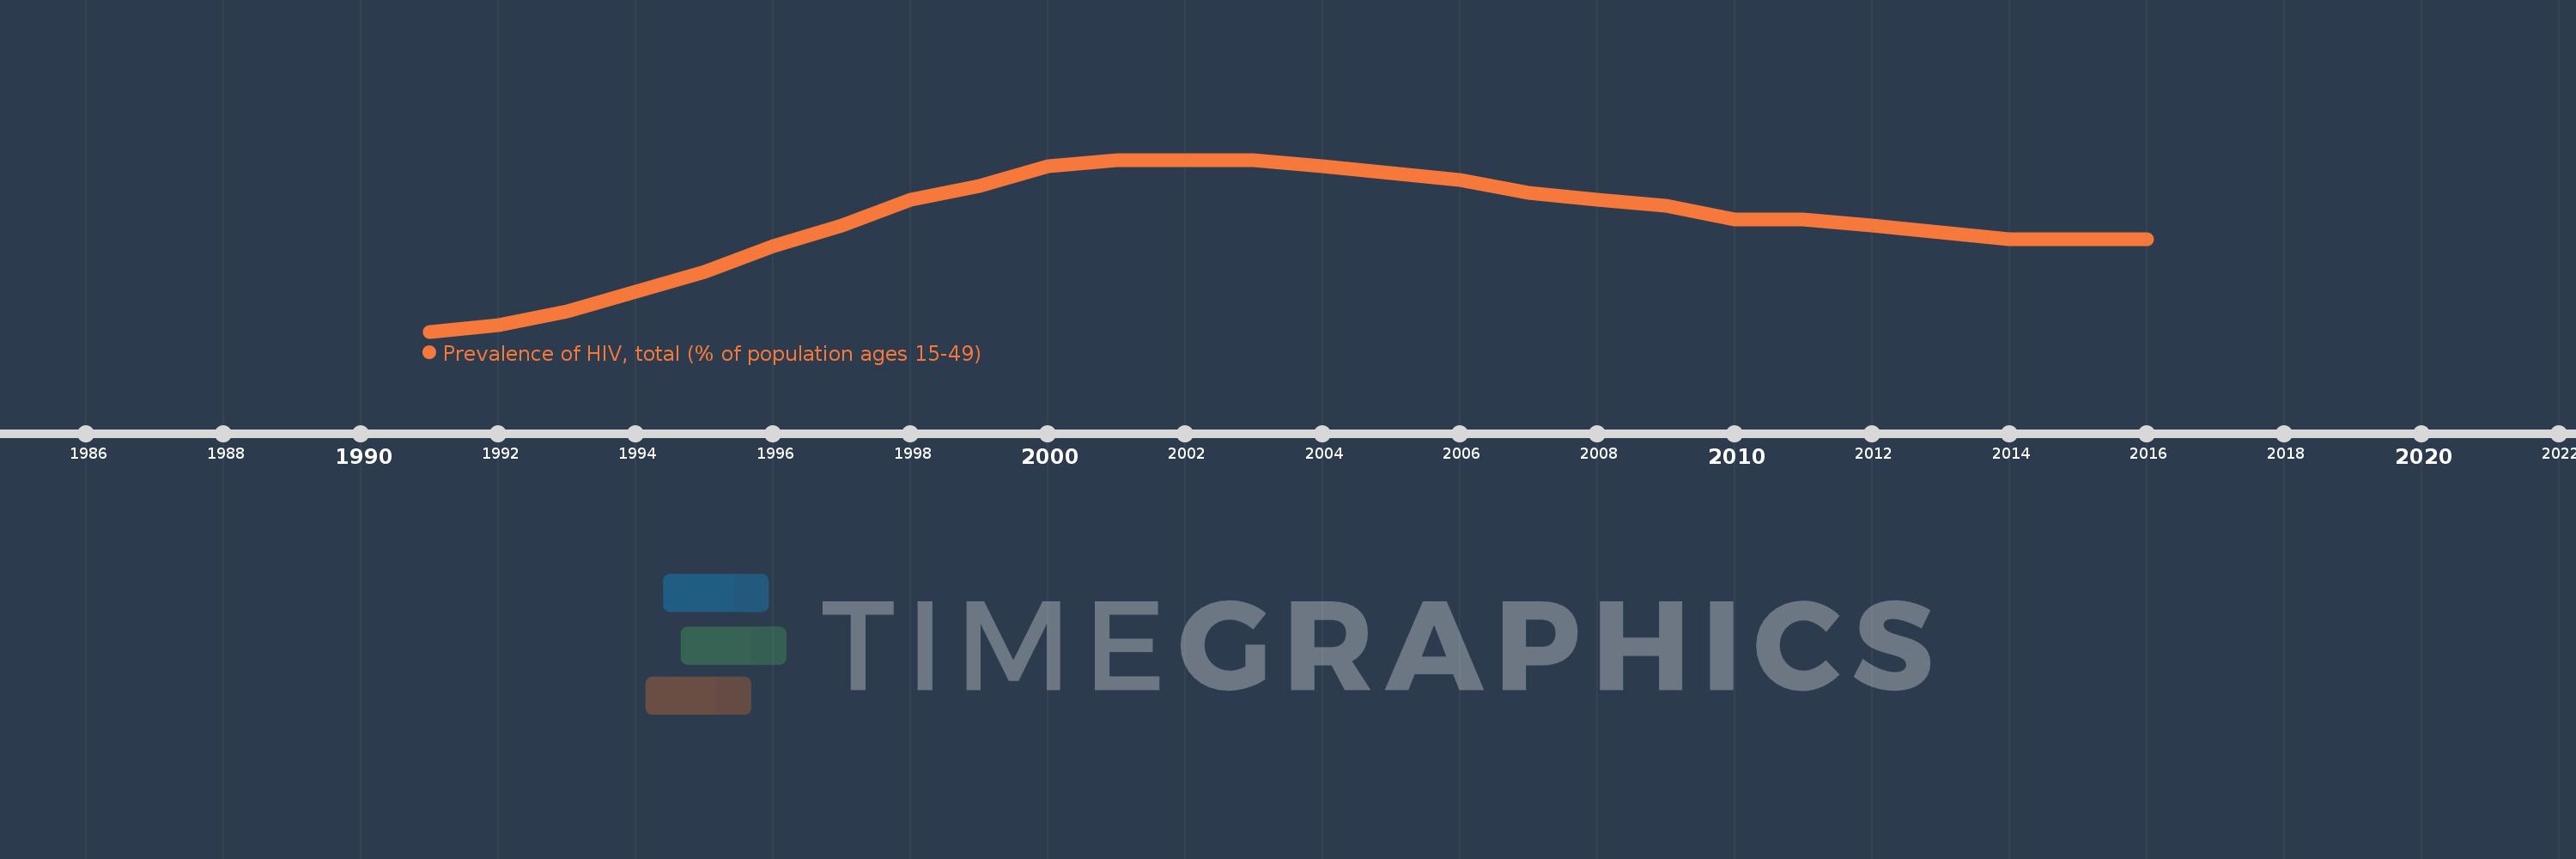
Prevalence of HIV, total (% of population ages 15-49)
2016,2015,2014,2013,2012,2011,2010,2009,2008,2007,2006,2005,2004,2003,2002,2001,2000,1999,1998,1997,1996,1995,1994,1993,1992,1991
This statistics in other country:
Timeline:
This timeline shows a graph from 1991 to 2016 of Djibouti. No data until 1990. Number of actual observations by date: 26.
Source name:
World Development Indicators
Source organization:
UNAIDS estimates.
Categories, topics:
Health, Aid Effectiveness
Last updated:
apr 23, 2017
Indicators value changes by year
At the date of observation
Value
Absolute change
Change from previous value
jan 1, 1992
0.3
+0.1
50.0%
jan 1, 1993
0.5
+0.2
66.67%
jan 1, 1994
0.8
+0.3
60.0%
jan 1, 1995
1.1
+0.3
37.5%
jan 1, 1996
1.5
+0.4
36.36%
jan 1, 1997
1.8
+0.3
20.0%
jan 1, 1998
2.2
+0.4
22.22%
jan 1, 1999
2.4
+0.2
9.09%
jan 1, 2000
2.7
+0.3
12.5%
jan 1, 2004
2.7
-0.1
-3.57%
jan 1, 2005
2.6
-0.1
-3.7%
jan 1, 2006
2.5
-0.1
-3.85%
jan 1, 2007
2.3
-0.2
-8.0%
jan 1, 2008
2.2
-0.1
-4.35%
jan 1, 2009
2.1
-0.1
-4.55%
jan 1, 2010
1.9
-0.2
-9.52%
jan 1, 2012
1.8
-0.1
-5.26%
jan 1, 2013
1.7
-0.1
-5.56%
jan 1, 2014
1.6
-0.1
-5.88%
Ranking of countries by current statistics by years


Comments: