29
/
en
AIzaSyAYiBZKx7MnpbEhh9jyipgxe19OcubqV5w
April 1, 2024
40270
IDA total
IDA
false
2
1
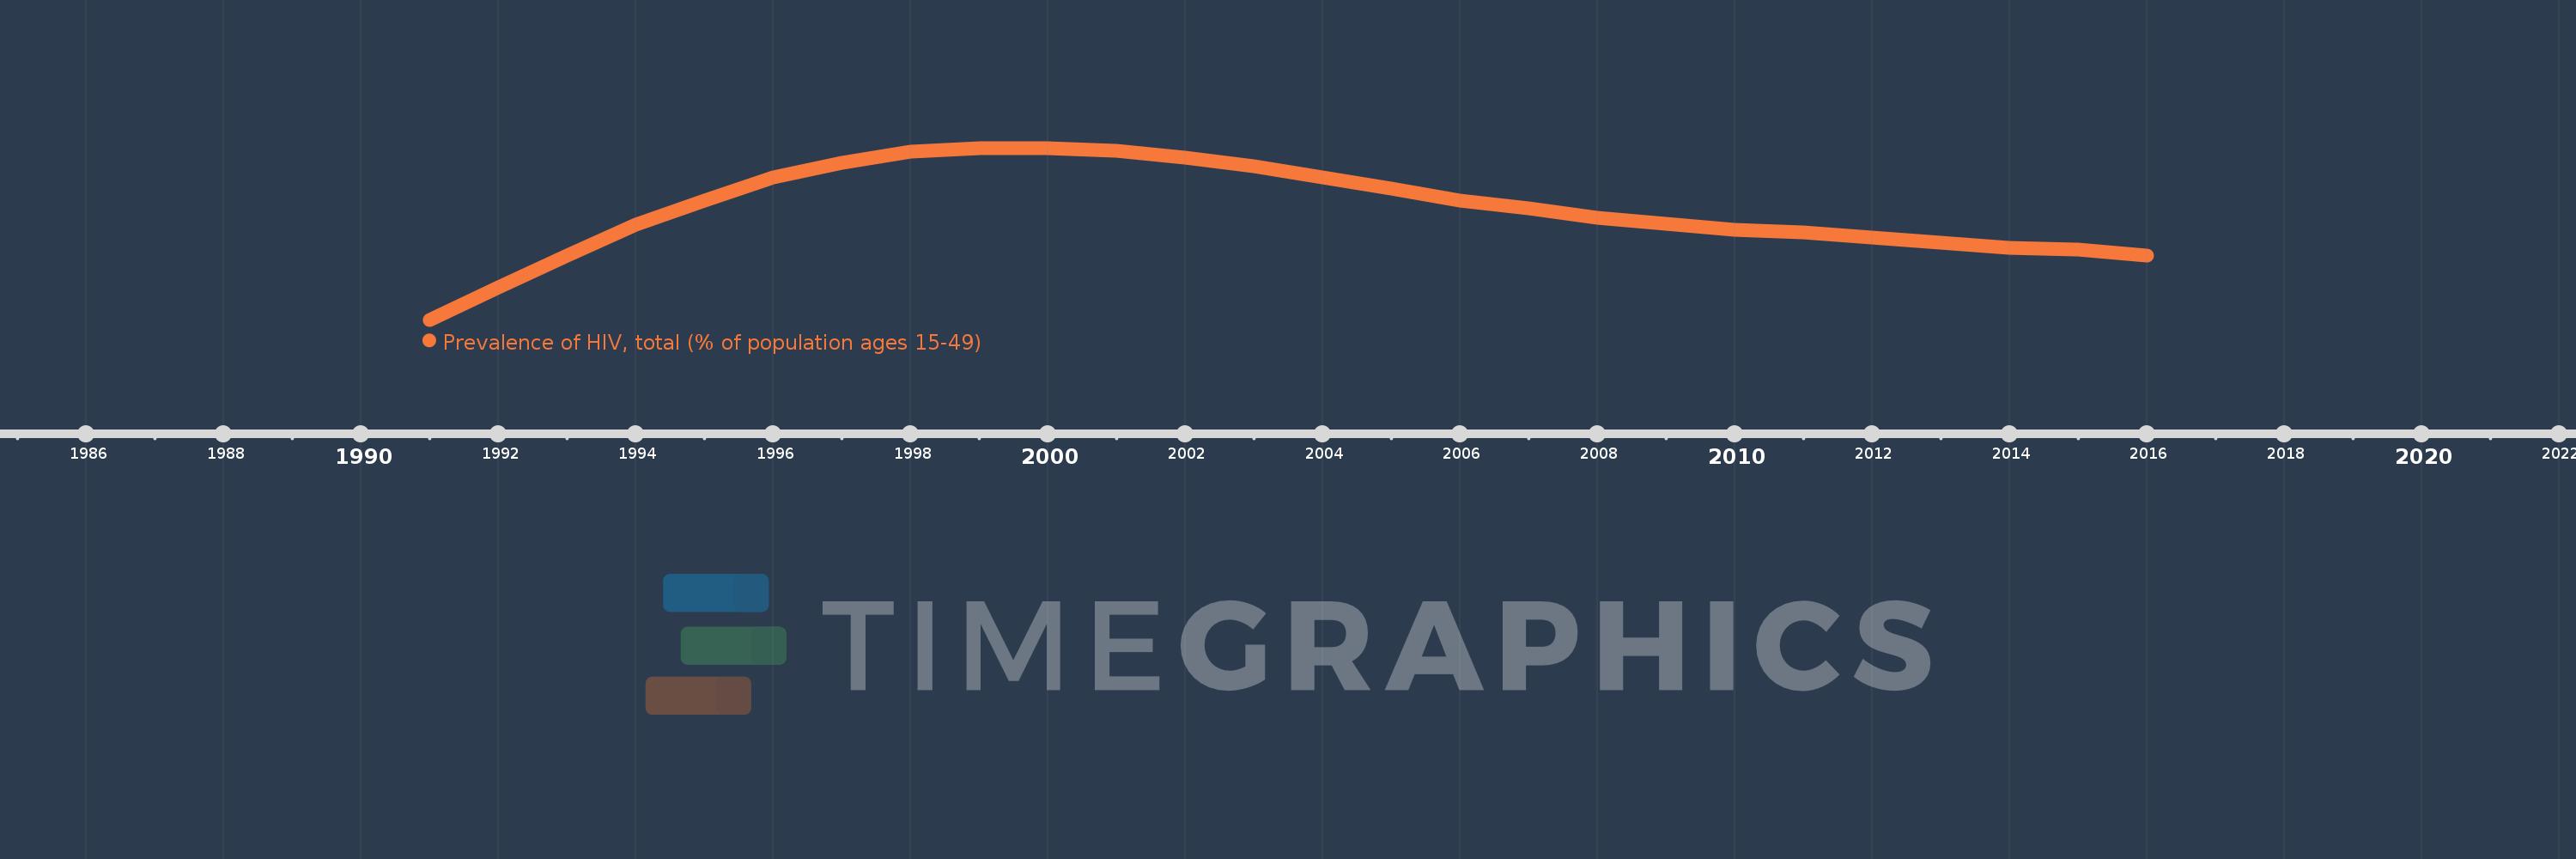
Prevalence of HIV, total (% of population ages 15-49)
2016,2015,2014,2013,2012,2011,2010,2009,2008,2007,2006,2005,2004,2003,2002,2001,2000,1999,1998,1997,1996,1995,1994,1993,1992,1991
This statistics in other country:
Timeline:
This timeline shows a graph from 1991 to 2016 of IDA total. No data until 1990. Number of actual observations by date: 26.
Source name:
World Development Indicators
Source organization:
UNAIDS estimates.
Categories, topics:
Health, Aid Effectiveness
Last updated:
apr 23, 2017
Indicators value changes by year
At the date of observation
Value
Absolute change
Change from previous value
jan 1, 1991
1.519
+1.519
0.0%
jan 1, 1992
1.715
+0.196
12.89%
jan 1, 1993
1.91
+0.195
11.38%
jan 1, 1994
2.097
+0.187
9.8%
jan 1, 1995
2.245
+0.148
7.06%
jan 1, 1996
2.389
+0.144
6.39%
jan 1, 1997
2.475
+0.086
3.6%
jan 1, 1998
2.542
+0.067
2.7%
jan 1, 1999
2.565
+0.023
0.92%
jan 1, 2000
2.567
+0.002
0.06%
jan 1, 2001
2.548
-0.019
-0.75%
jan 1, 2002
2.51
-0.038
-1.47%
jan 1, 2003
2.454
-0.056
-2.24%
jan 1, 2004
2.387
-0.067
-2.73%
jan 1, 2005
2.32
-0.066
-2.77%
jan 1, 2006
2.246
-0.075
-3.22%
jan 1, 2007
2.197
-0.049
-2.18%
jan 1, 2008
2.14
-0.057
-2.6%
jan 1, 2009
2.103
-0.037
-1.71%
jan 1, 2010
2.069
-0.034
-1.6%
jan 1, 2011
2.053
-0.016
-0.78%
jan 1, 2012
2.019
-0.034
-1.66%
jan 1, 2013
1.987
-0.032
-1.61%
jan 1, 2014
1.959
-0.027
-1.38%
jan 1, 2015
1.945
-0.015
-0.75%
jan 1, 2016
1.908
-0.037
-1.89%
Ranking of countries by current statistics by years


Comments: