29
/
en
AIzaSyAYiBZKx7MnpbEhh9jyipgxe19OcubqV5w
April 1, 2024
34788
Heavily indebted poor countries (HIPC)
HPC
false
2
1
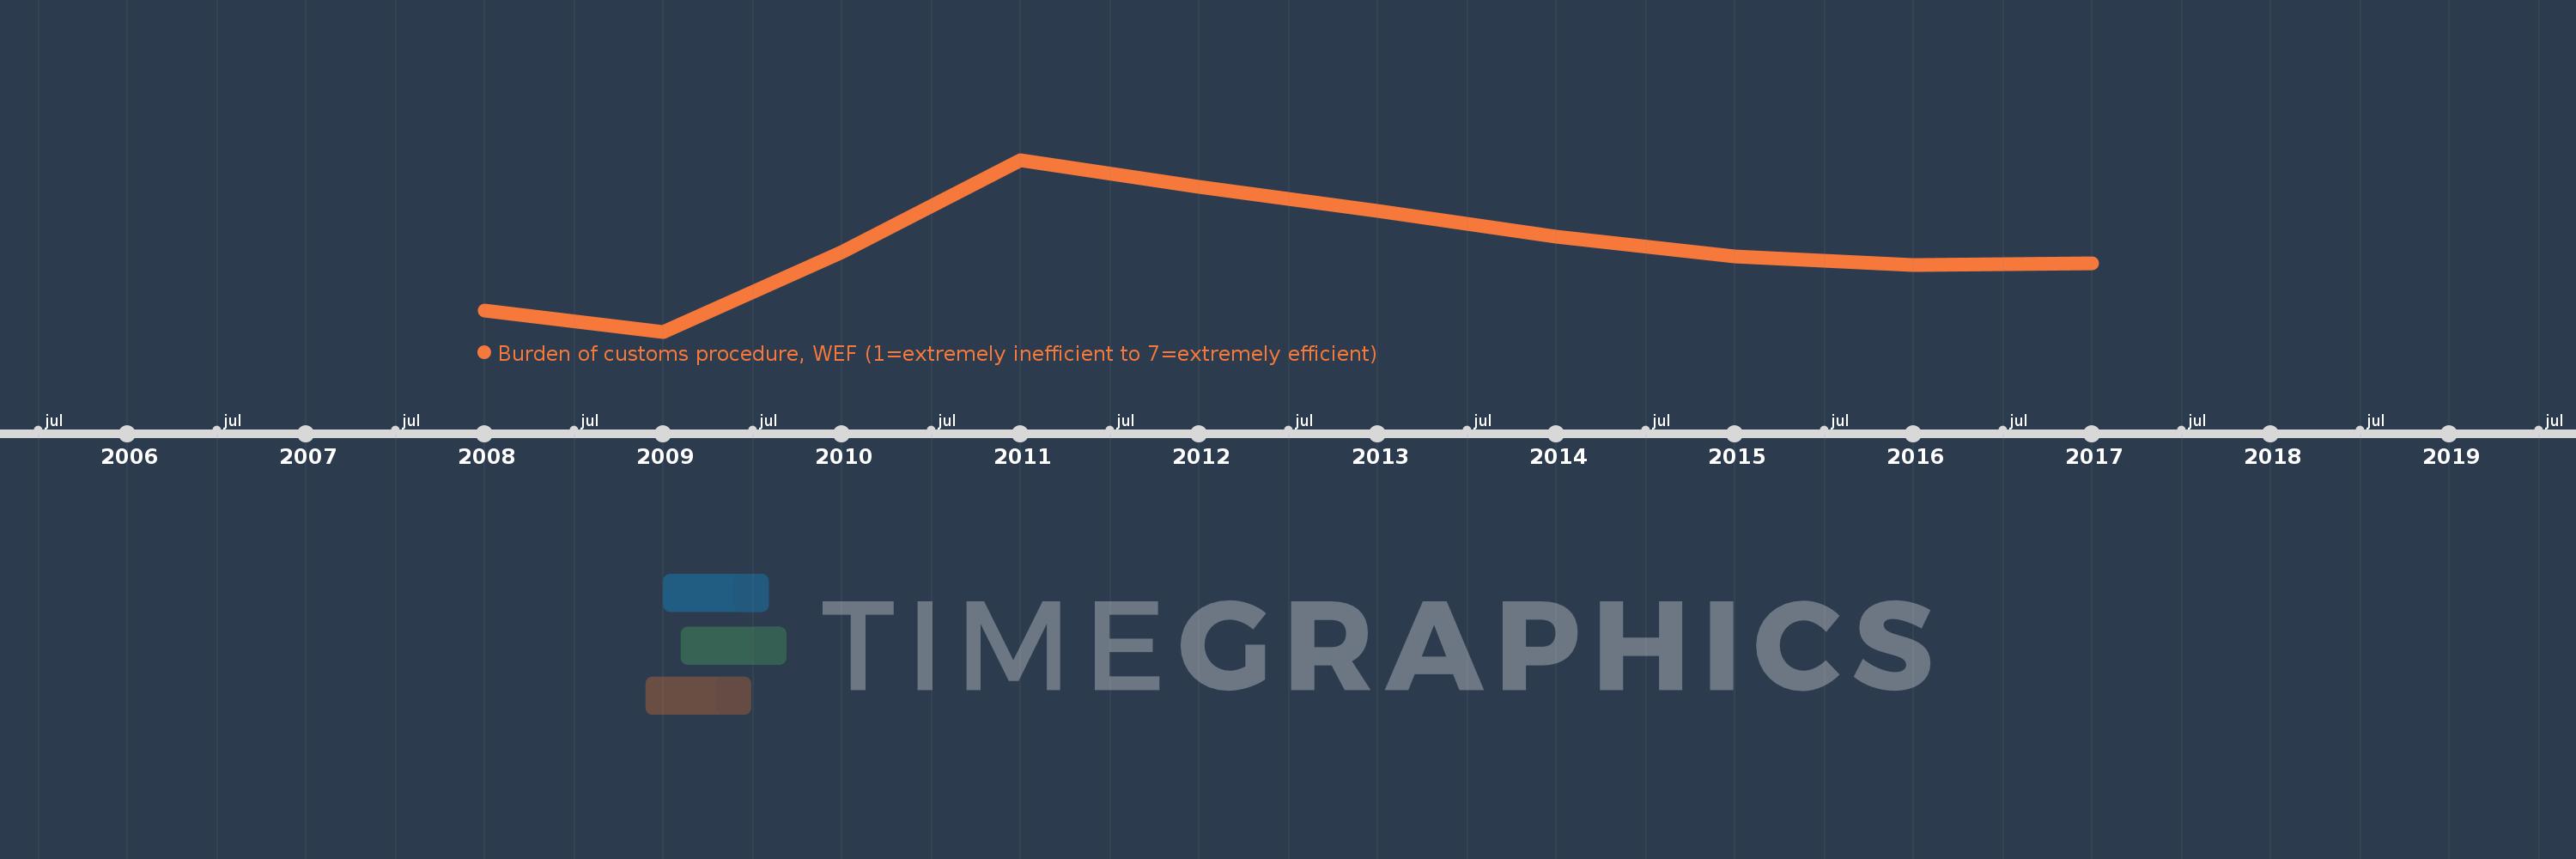
Burden of customs procedure, WEF (1=extremely inefficient to 7=extremely efficient)
2017,2016,2015,2014,2013,2012,2011,2010,2009,2008
This statistics in other country:
Timeline:
This timeline shows a graph from 2008 to 2017 of Heavily indebted poor countries (HIPC). No data until 2007. Number of actual observations by date: 10.
Source name:
World Development Indicators
Source organization:
World Economic Forum, Global Competiveness Report and data files.
Categories, topics:
Private Sector
Last updated:
apr 23, 2017
Indicators value changes by year
At the date of observation
Value
Absolute change
Change from previous value
jan 1, 2008
3.252
+3.252
0.0%
jan 1, 2009
3.16
-0.092
-2.82%
jan 1, 2010
3.5
+0.34
10.76%
jan 1, 2011
3.899
+0.399
11.4%
jan 1, 2012
3.783
-0.116
-2.97%
jan 1, 2013
3.678
-0.106
-2.79%
jan 1, 2014
3.567
-0.111
-3.02%
jan 1, 2015
3.484
-0.083
-2.32%
jan 1, 2016
3.448
-0.036
-1.04%
jan 1, 2017
3.454
+0.006
0.17%
Ranking of countries by current statistics by years


Comments: