29
/
en
AIzaSyAYiBZKx7MnpbEhh9jyipgxe19OcubqV5w
April 1, 2024
186216
Malawi
MWI
true
2
1
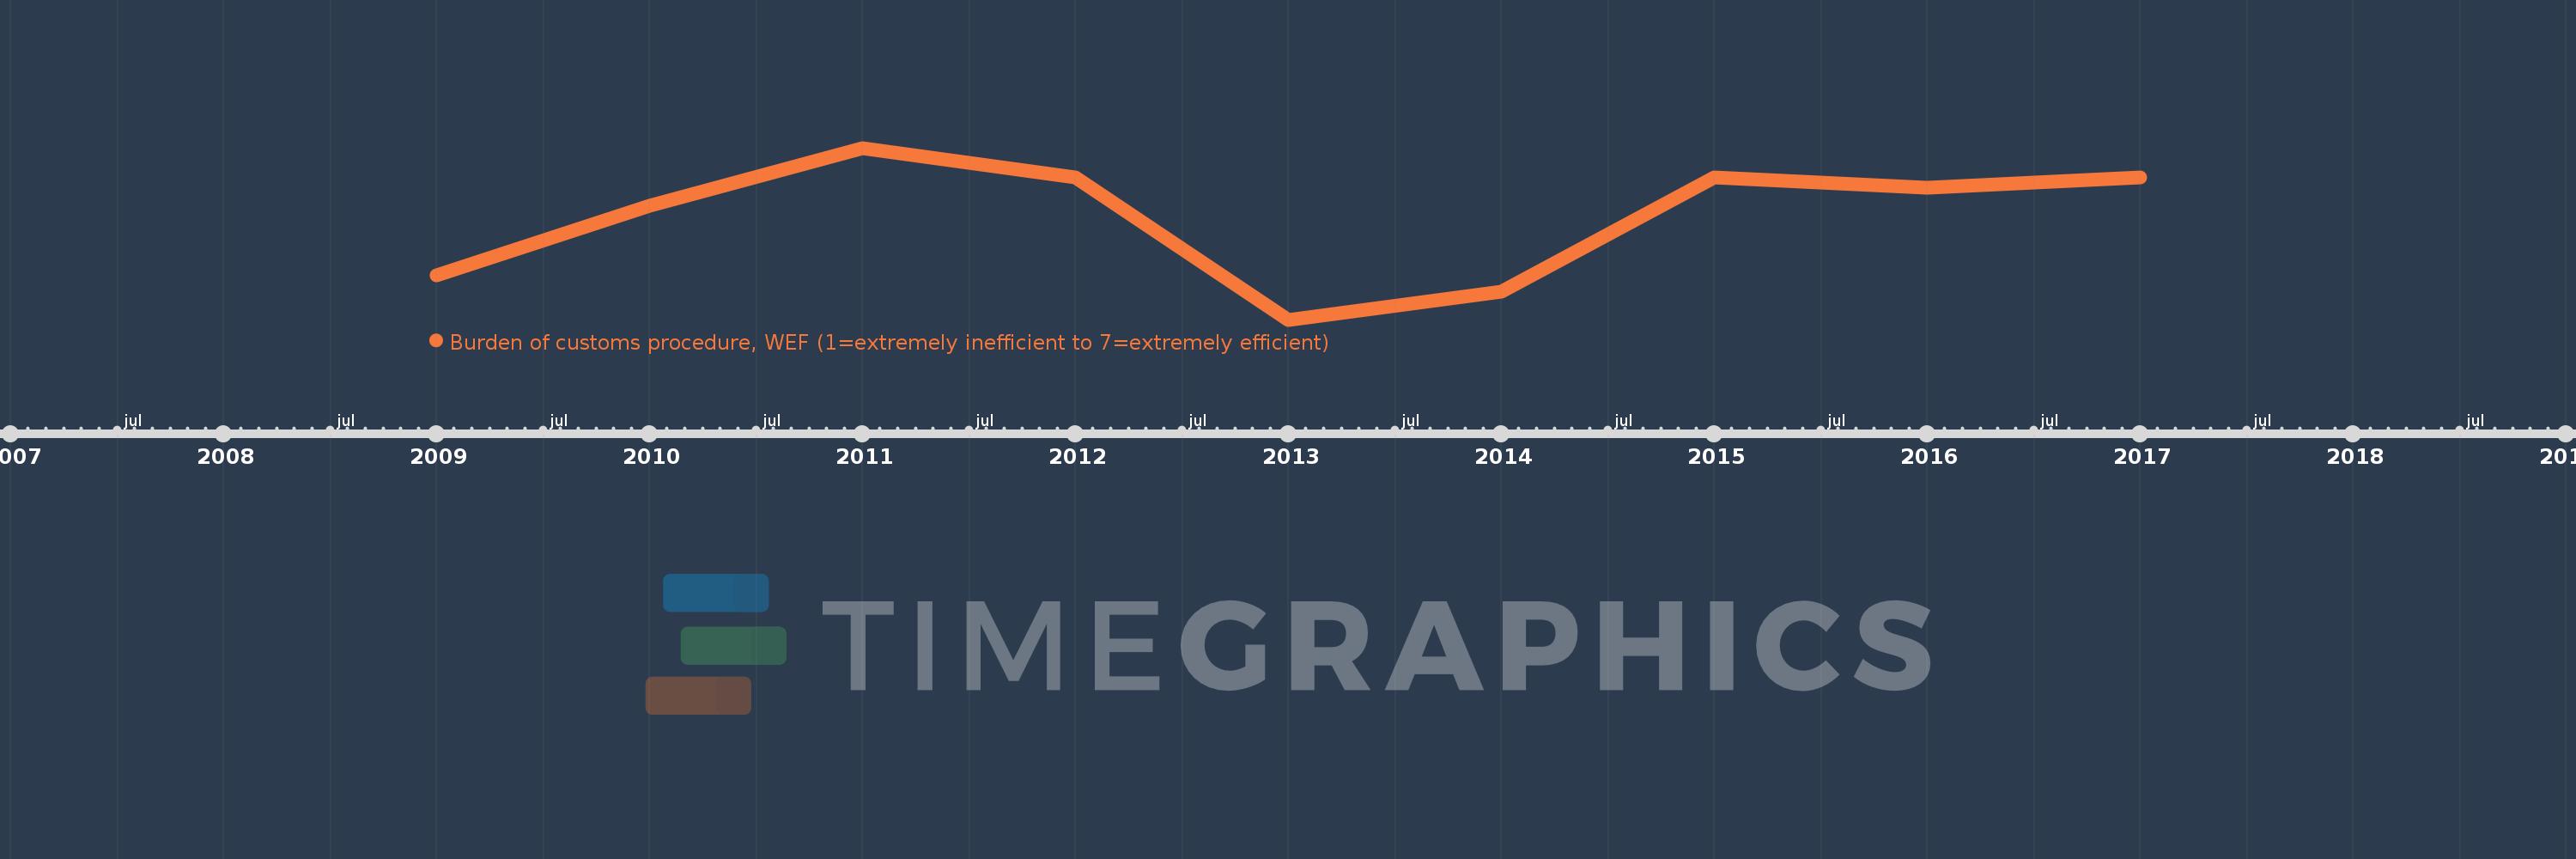
Burden of customs procedure, WEF (1=extremely inefficient to 7=extremely efficient)
2017,2016,2015,2014,2013,2012,2011,2010,2009
This statistics in other country:
Timeline:
This timeline shows a graph from 2009 to 2017 of Malawi. No data until 2008. Number of actual observations by date: 9.
Source name:
World Development Indicators
Source organization:
World Economic Forum, Global Competiveness Report and data files.
Categories, topics:
Private Sector
Last updated:
apr 23, 2017
Indicators value changes by year
At the date of observation
Value
Absolute change
Change from previous value
jan 1, 2009
3.456
+3.456
0.0%
jan 1, 2010
3.701
+0.246
7.11%
jan 1, 2011
3.905
+0.204
5.51%
jan 1, 2012
3.8
-0.105
-2.7%
jan 1, 2013
3.3
-0.5
-13.16%
jan 1, 2014
3.4
+0.1
3.03%
jan 1, 2015
3.8
+0.4
11.76%
jan 1, 2016
3.764
-0.036
-0.95%
jan 1, 2017
3.8
+0.036
0.96%
Ranking of countries by current statistics by years


Comments: