29
/
en
AIzaSyAYiBZKx7MnpbEhh9jyipgxe19OcubqV5w
April 1, 2024
52440
OECD members
OED
false
2
1
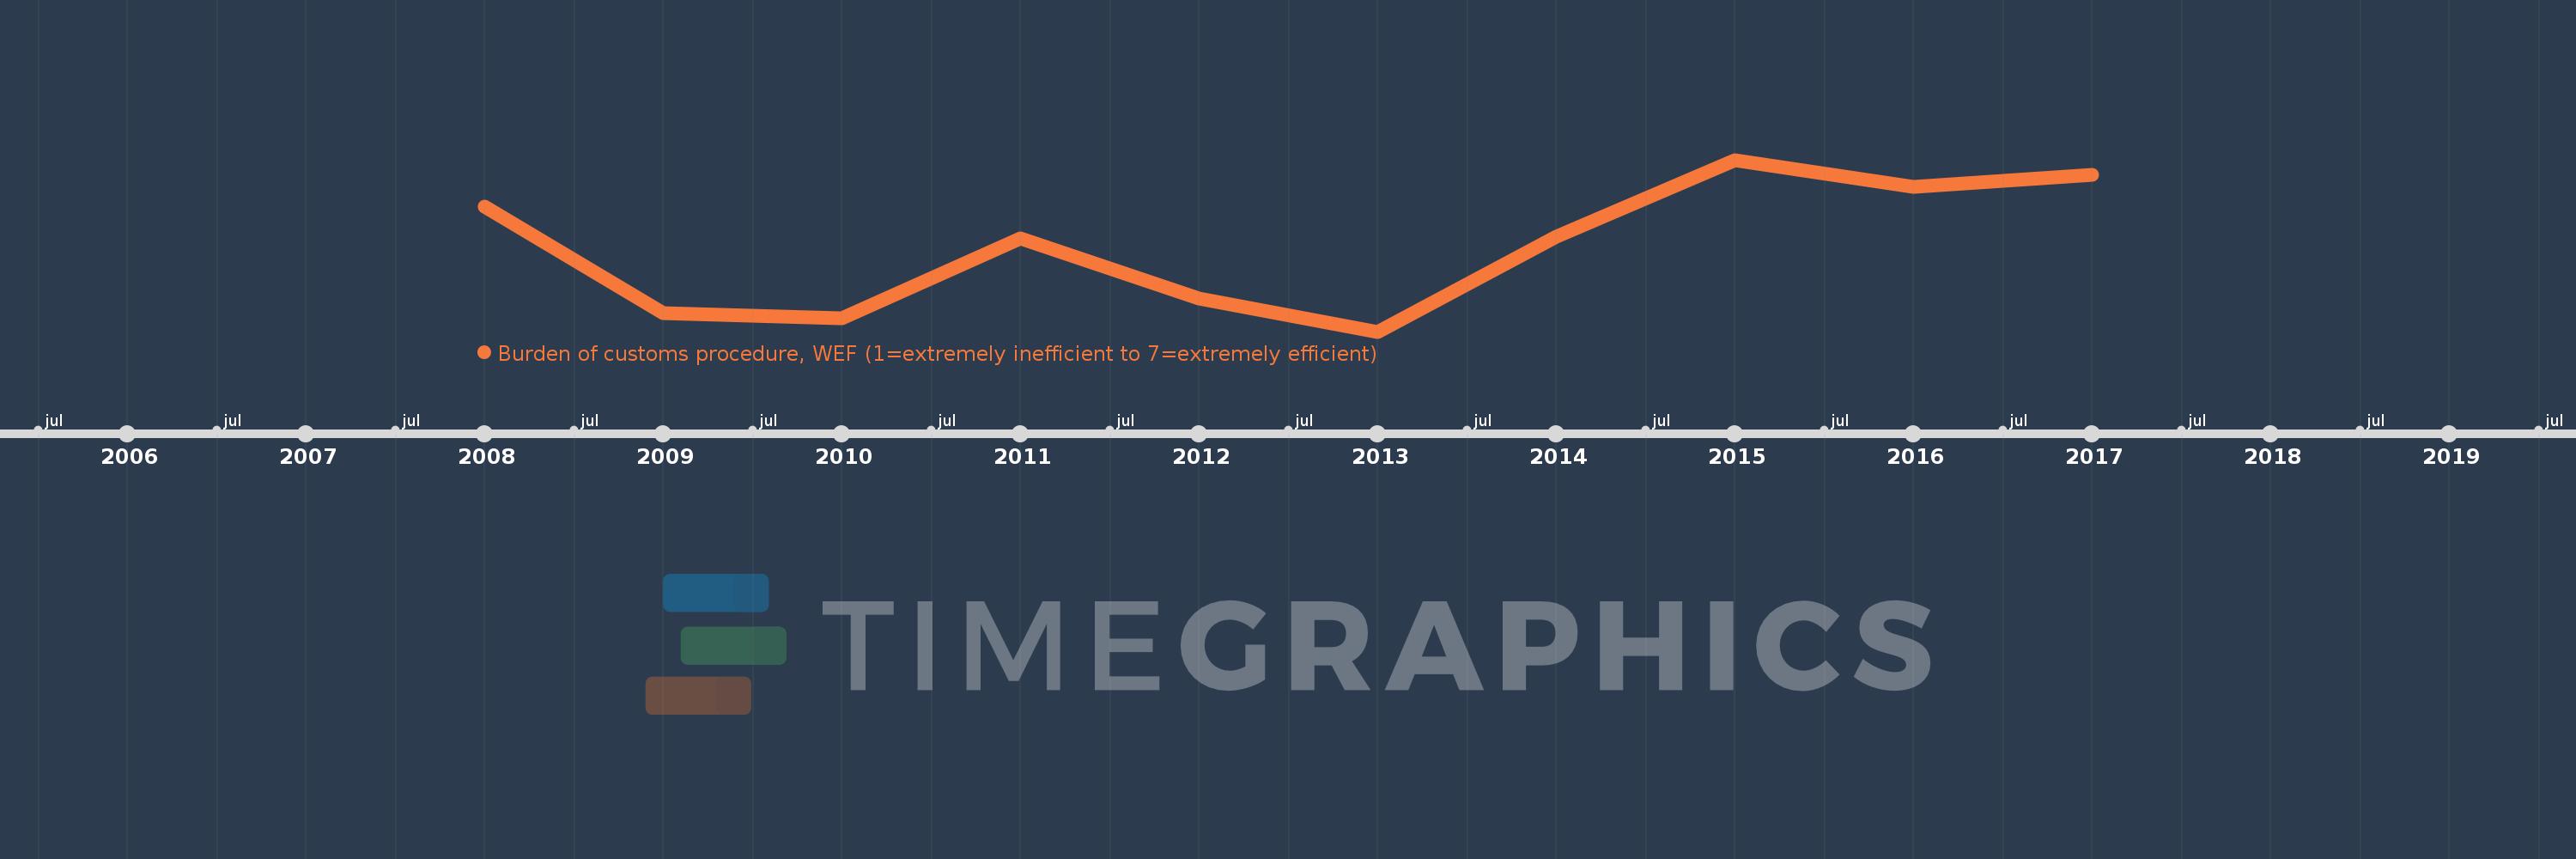
Burden of customs procedure, WEF (1=extremely inefficient to 7=extremely efficient)
2017,2016,2015,2014,2013,2012,2011,2010,2009,2008
This statistics in other country:
Timeline:
This timeline shows a graph from 2008 to 2017 of OECD members. No data until 2007. Number of actual observations by date: 10.
Source name:
World Development Indicators
Source organization:
World Economic Forum, Global Competiveness Report and data files.
Categories, topics:
Private Sector
Last updated:
apr 23, 2017
Indicators value changes by year
At the date of observation
Value
Absolute change
Change from previous value
jan 1, 2008
4.892
+4.892
0.0%
jan 1, 2009
4.828
-0.064
-1.3%
jan 1, 2010
4.825
-0.003
-0.07%
jan 1, 2011
4.873
+0.048
0.99%
jan 1, 2012
4.837
-0.036
-0.73%
jan 1, 2013
4.817
-0.02
-0.41%
jan 1, 2014
4.874
+0.057
1.19%
jan 1, 2015
4.92
+0.046
0.94%
jan 1, 2016
4.904
-0.016
-0.32%
jan 1, 2017
4.911
+0.007
0.15%
Ranking of countries by current statistics by years


Comments: