29
/
en
AIzaSyAYiBZKx7MnpbEhh9jyipgxe19OcubqV5w
April 1, 2024
56813
South Asia
SAS
false
2
1
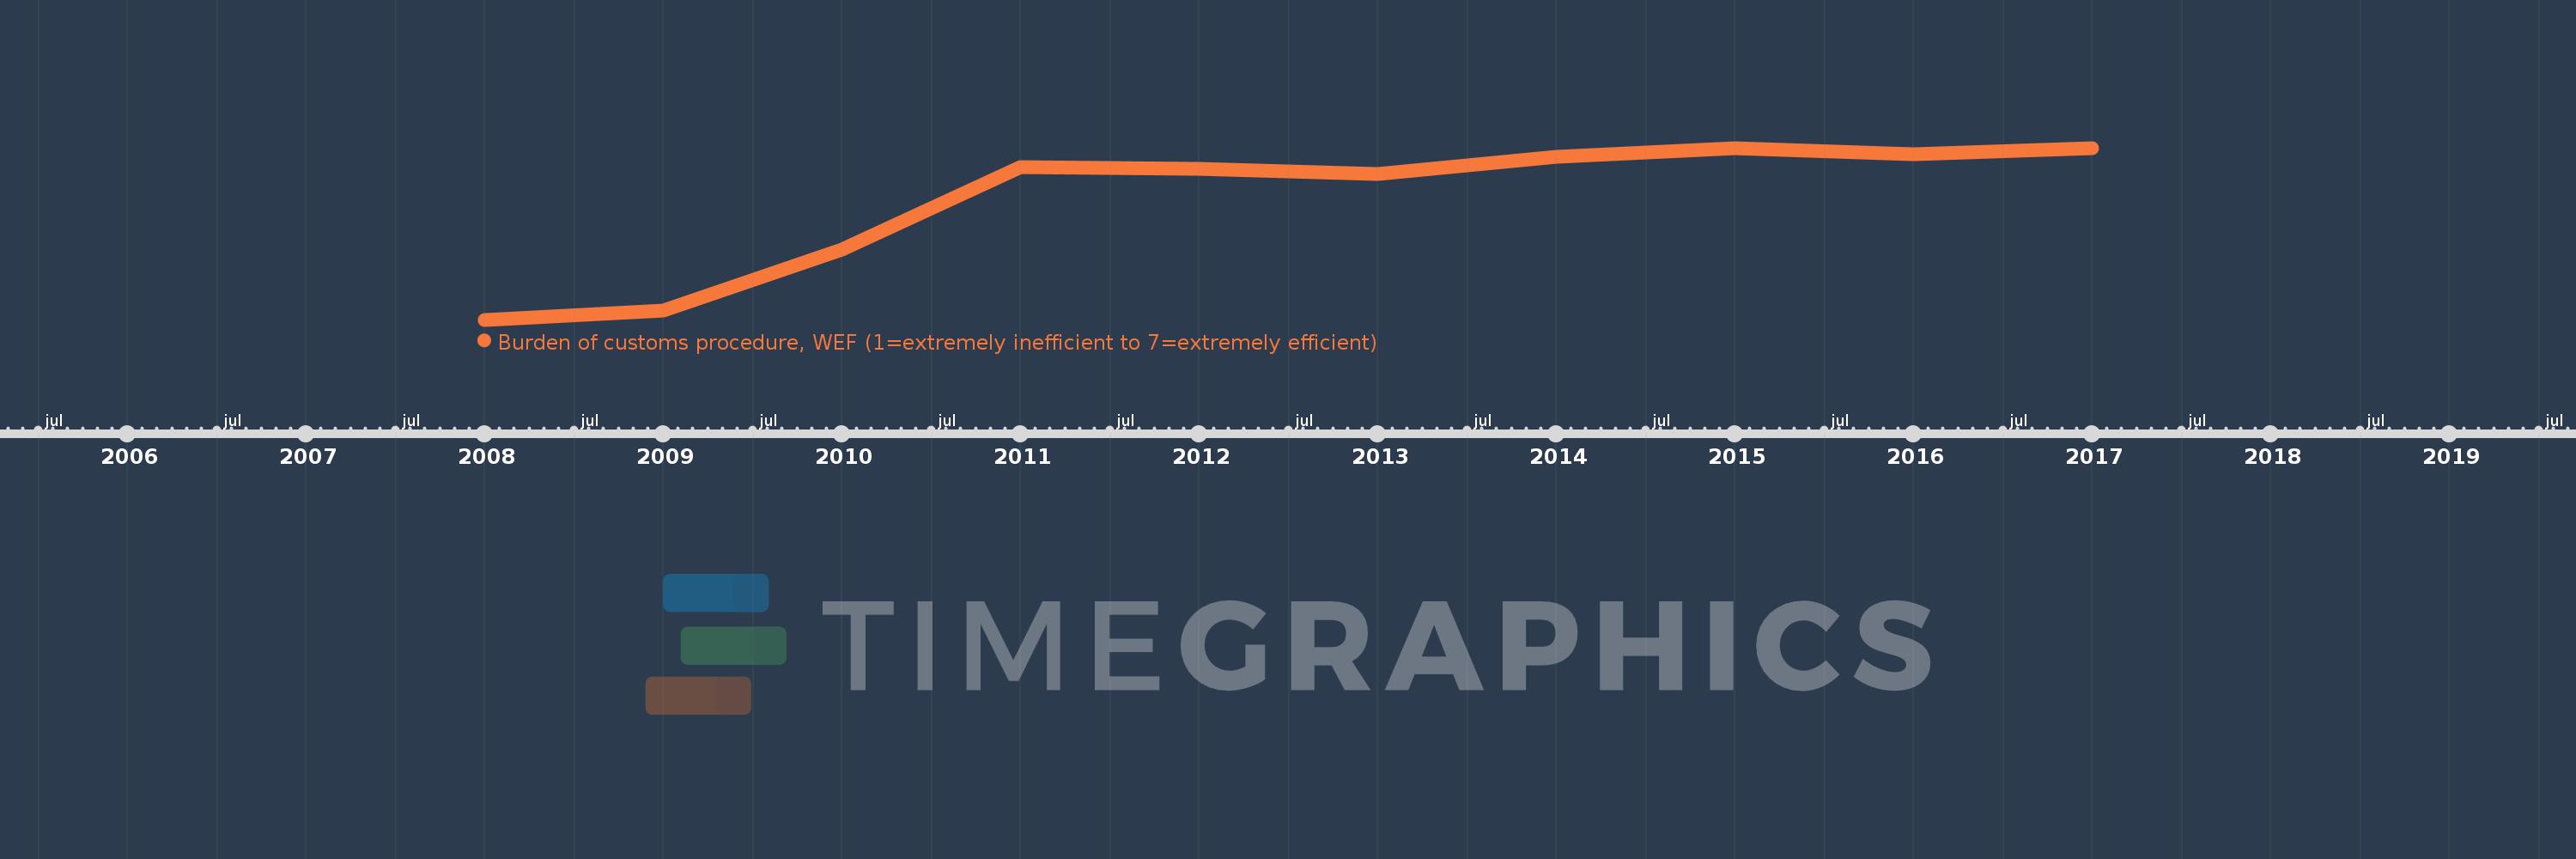
Burden of customs procedure, WEF (1=extremely inefficient to 7=extremely efficient)
2017,2016,2015,2014,2013,2012,2011,2010,2009,2008
This statistics in other country:
Timeline:
This timeline shows a graph from 2008 to 2017 of South Asia. No data until 2007. Number of actual observations by date: 10.
Source name:
World Development Indicators
Source organization:
World Economic Forum, Global Competiveness Report and data files.
Categories, topics:
Private Sector
Last updated:
apr 23, 2017
Indicators value changes by year
At the date of observation
Value
Absolute change
Change from previous value
jan 1, 2008
3.15
+3.15
0.0%
jan 1, 2009
3.185
+0.035
1.12%
jan 1, 2010
3.416
+0.231
7.25%
jan 1, 2011
3.728
+0.312
9.13%
jan 1, 2012
3.72
-0.008
-0.21%
jan 1, 2013
3.7
-0.02
-0.54%
jan 1, 2014
3.767
+0.067
1.8%
jan 1, 2015
3.8
+0.033
0.88%
jan 1, 2016
3.775
-0.025
-0.65%
jan 1, 2017
3.8
+0.025
0.65%
Ranking of countries by current statistics by years


Comments: