29
/
en
AIzaSyAYiBZKx7MnpbEhh9jyipgxe19OcubqV5w
April 1, 2024
118685
Denmark
DNK
true
2
1
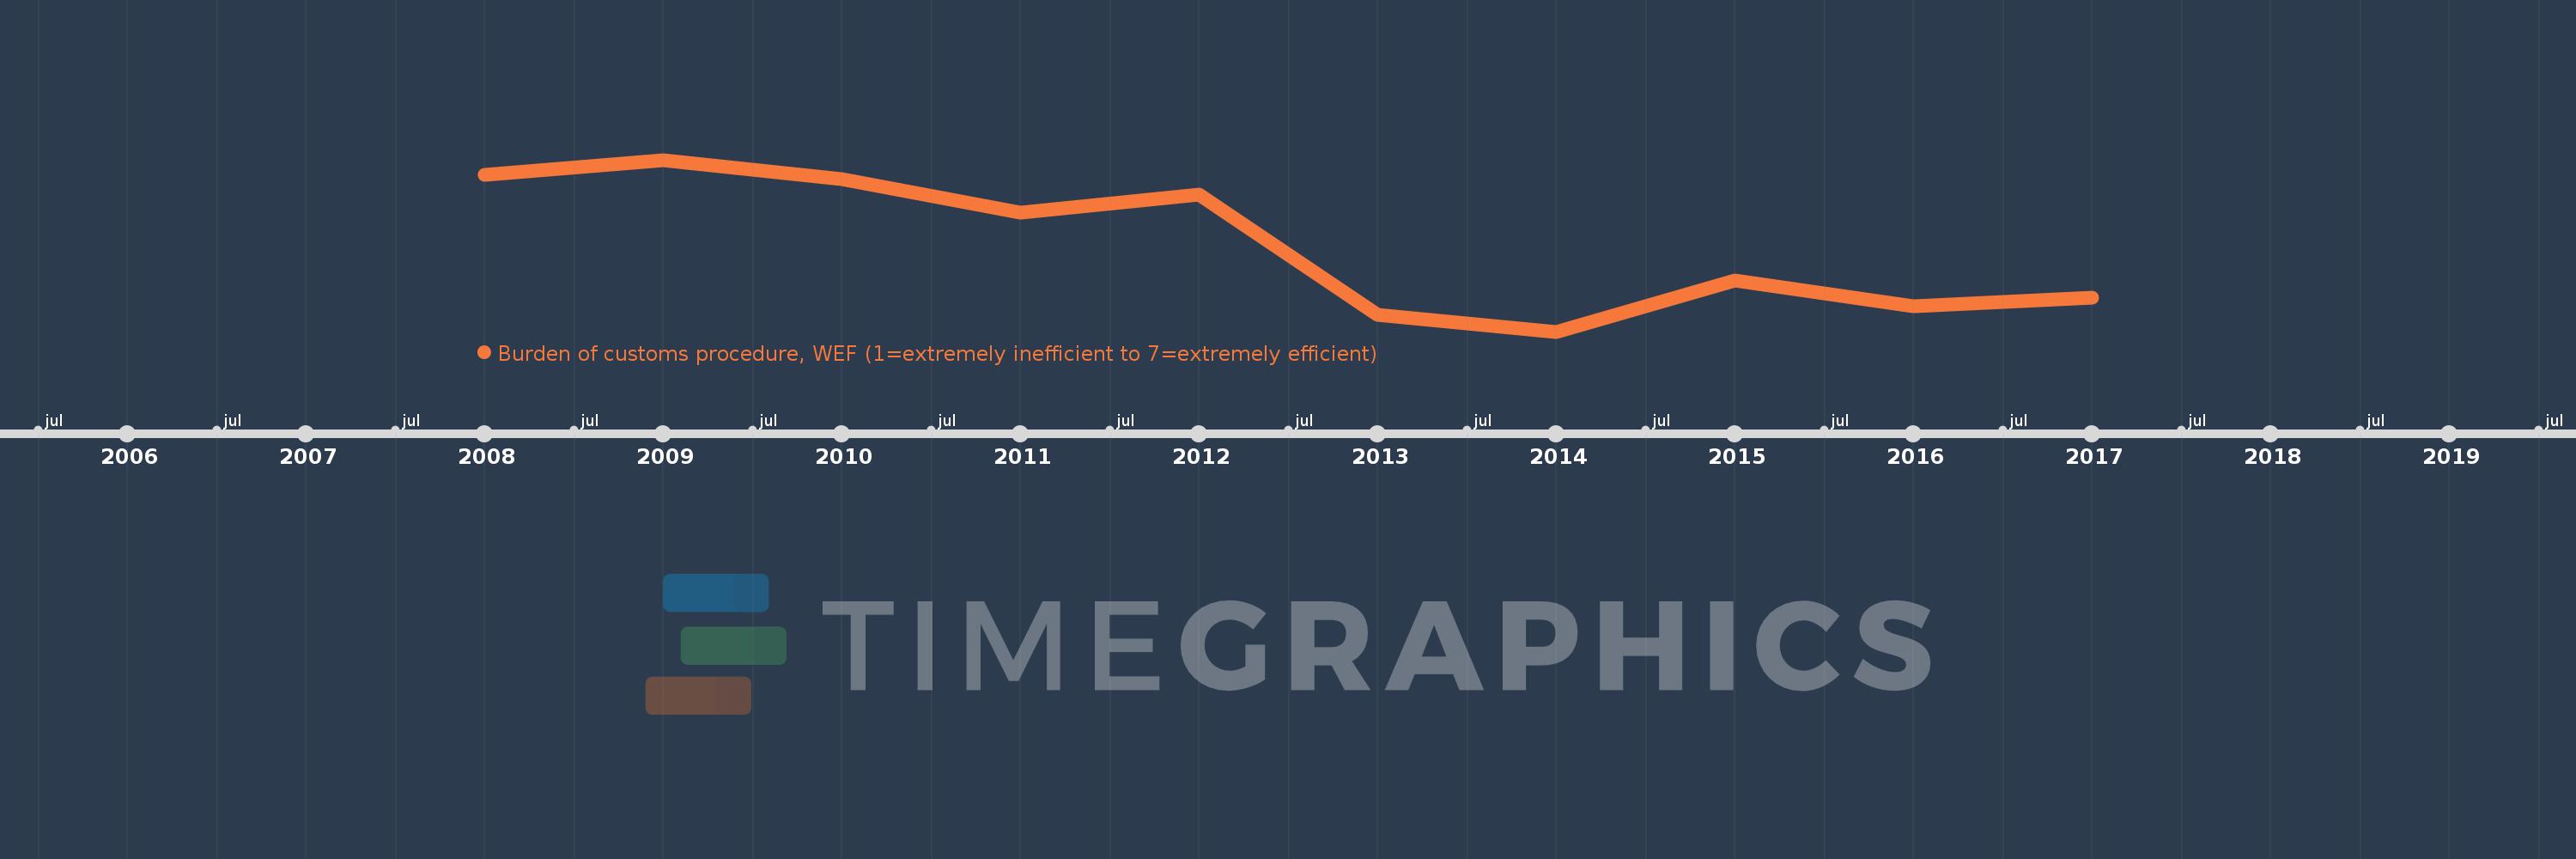
Burden of customs procedure, WEF (1=extremely inefficient to 7=extremely efficient)
2017,2016,2015,2014,2013,2012,2011,2010,2009,2008
This statistics in other country:
Timeline:
This timeline shows a graph from 2008 to 2017 of Denmark. No data until 2007. Number of actual observations by date: 10.
Source name:
World Development Indicators
Source organization:
World Economic Forum, Global Competiveness Report and data files.
Categories, topics:
Private Sector
Last updated:
apr 23, 2017
Indicators value changes by year
At the date of observation
Value
Absolute change
Change from previous value
jan 1, 2008
5.812
+5.812
0.0%
jan 1, 2009
5.9
+0.088
1.51%
jan 1, 2010
5.79
-0.11
-1.86%
jan 1, 2011
5.593
-0.196
-3.39%
jan 1, 2012
5.7
+0.107
1.91%
jan 1, 2013
5.0
-0.7
-12.28%
jan 1, 2014
4.9
-0.1
-2.0%
jan 1, 2015
5.2
+0.3
6.12%
jan 1, 2016
5.05
-0.15
-2.88%
jan 1, 2017
5.1
+0.05
0.98%
Ranking of countries by current statistics by years


Comments: