29
/
en
AIzaSyAYiBZKx7MnpbEhh9jyipgxe19OcubqV5w
April 1, 2024
33349
European Union
EUU
false
2
1
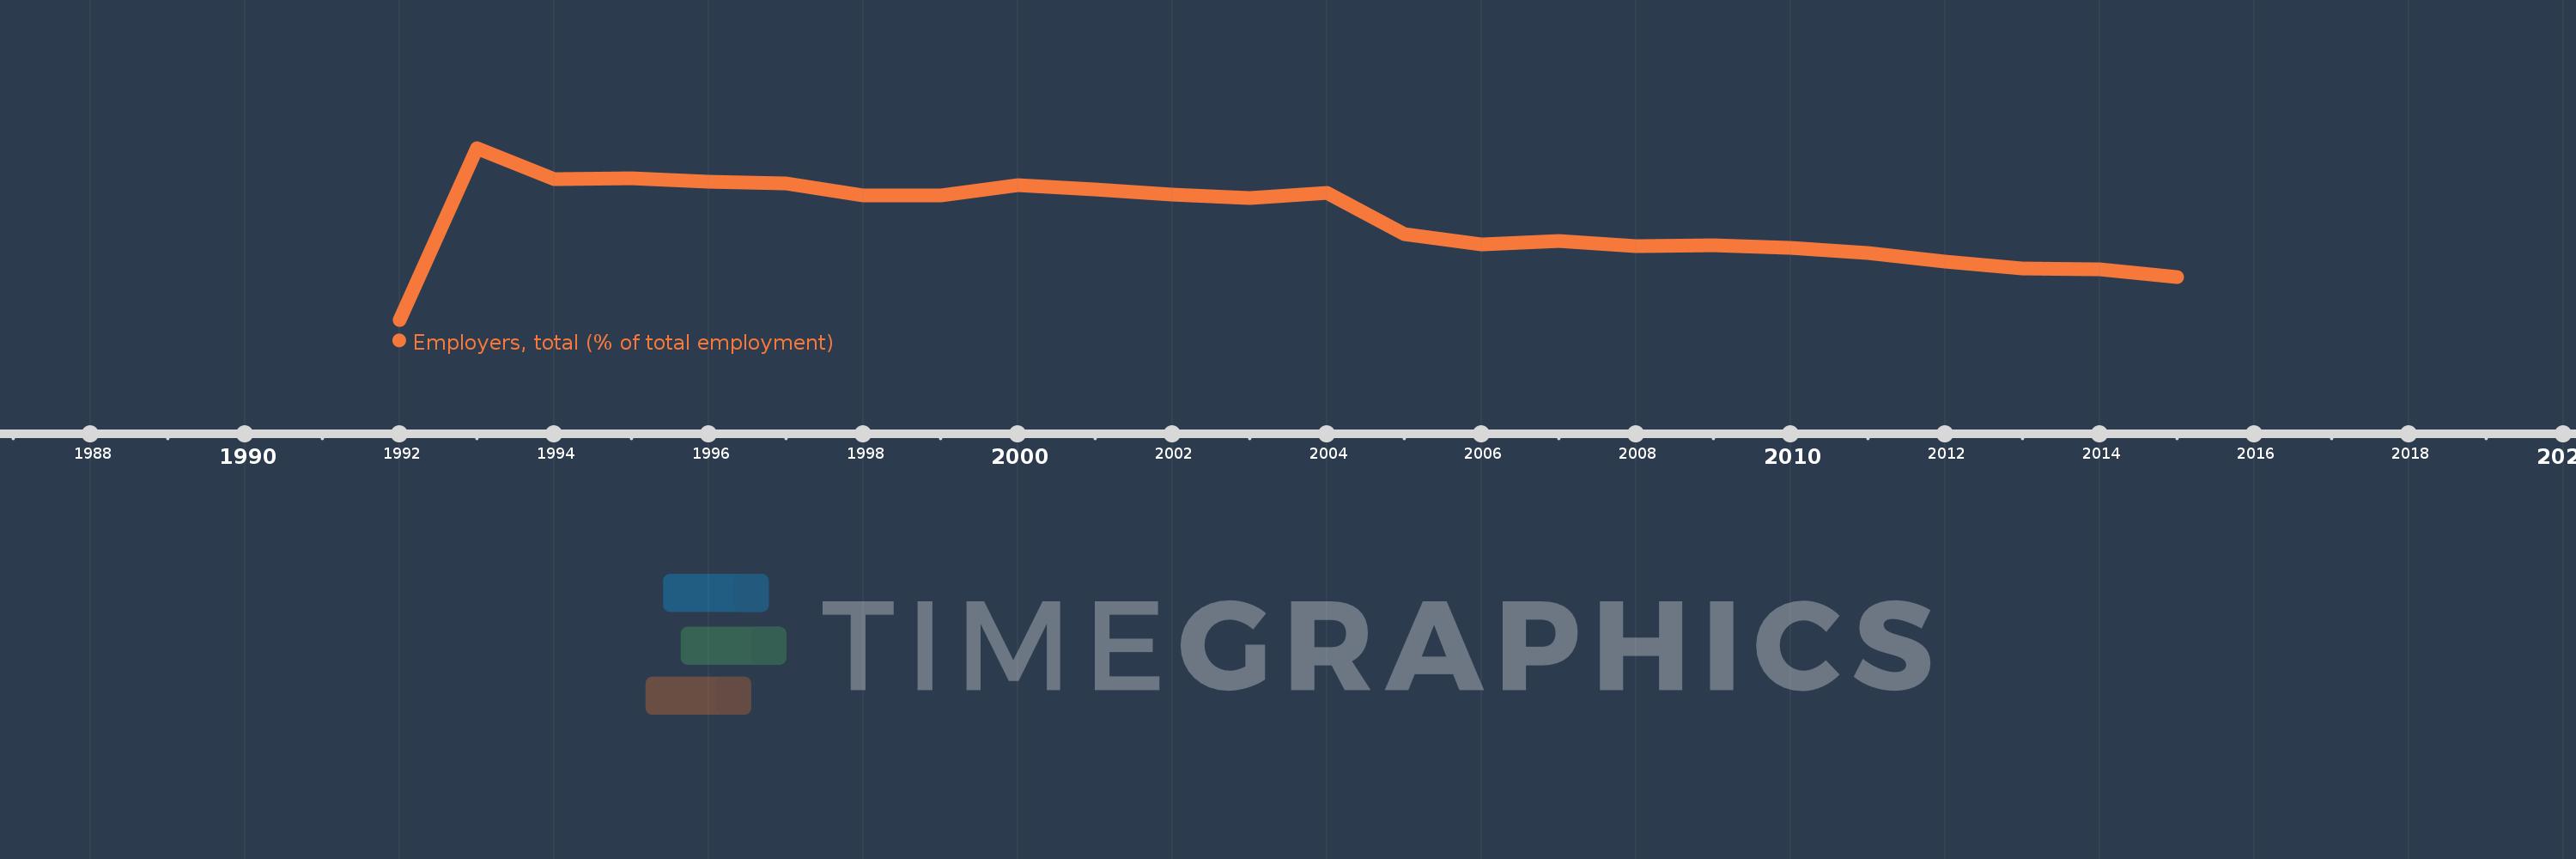
Employers, total (% of total employment)
2015,2014,2013,2012,2011,2010,2009,2008,2007,2006,2005,2004,2003,2002,2001,2000,1999,1998,1997,1996,1995,1994,1993,1992
This statistics in other country:
Timeline:
This timeline shows a graph from 1992 to 2015 of European Union. No data until 1991. Number of actual observations by date: 24.
Source name:
World Development Indicators
Source organization:
ILO Key Indicators of the Labour Market (KILM).
Categories, topics:
Social Protection & Labor
Last updated:
apr 23, 2017
Indicators value changes by year
At the date of observation
Value
Absolute change
Change from previous value
jan 1, 1992
3.811
+3.811
0.0%
jan 1, 1993
5.486
+1.675
43.97%
jan 1, 1994
5.182
-0.304
-5.55%
jan 1, 1995
5.188
+0.006
0.12%
jan 1, 1996
5.161
-0.027
-0.52%
jan 1, 1997
5.138
-0.023
-0.45%
jan 1, 1998
5.02
-0.118
-2.29%
jan 1, 1999
5.021
+0.0
0.01%
jan 1, 2000
5.126
+0.105
2.1%
jan 1, 2001
5.084
-0.042
-0.82%
jan 1, 2002
5.03
-0.054
-1.06%
jan 1, 2003
4.995
-0.036
-0.71%
jan 1, 2004
5.045
+0.05
1.0%
jan 1, 2005
4.648
-0.397
-7.87%
jan 1, 2006
4.544
-0.104
-2.23%
jan 1, 2007
4.577
+0.032
0.71%
jan 1, 2008
4.527
-0.049
-1.08%
jan 1, 2009
4.539
+0.011
0.25%
jan 1, 2010
4.512
-0.026
-0.58%
jan 1, 2011
4.461
-0.051
-1.14%
jan 1, 2012
4.379
-0.082
-1.83%
jan 1, 2013
4.312
-0.067
-1.54%
jan 1, 2014
4.303
-0.008
-0.19%
jan 1, 2015
4.224
-0.079
-1.84%
Ranking of countries by current statistics by years


Comments: