29
/
en
AIzaSyAYiBZKx7MnpbEhh9jyipgxe19OcubqV5w
April 1, 2024
42288
Latin America & Caribbean (excluding high income)
LAC
false
2
1
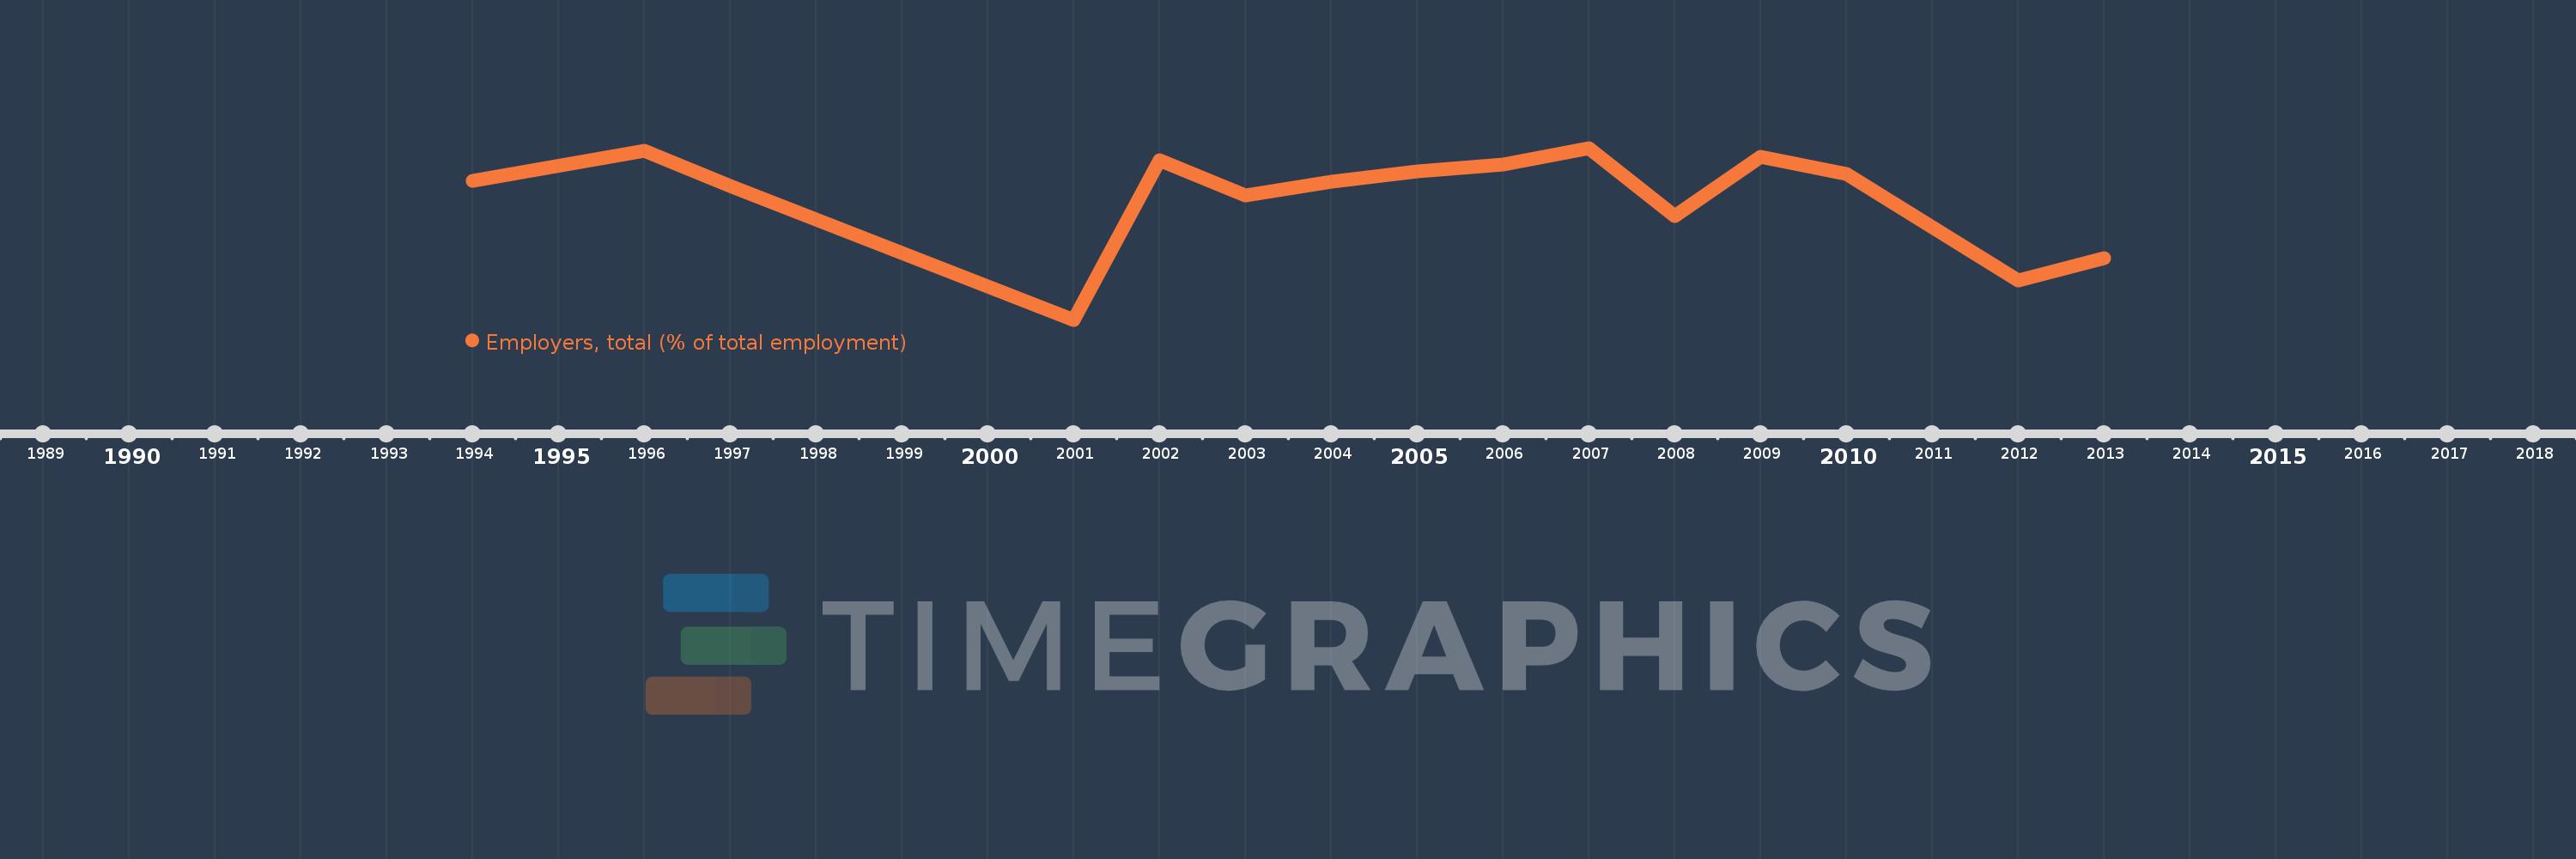
Employers, total (% of total employment)
2013,2012,2010,2009,2008,2007,2006,2005,2004,2003,2002,2001,1997,1996,1994
This statistics in other country:
Timeline:
This timeline shows a graph from 1994 to 2013 of Latin America & Caribbean (excluding high income). No data until 1993. Number of actual observations by date: 15.
Source name:
World Development Indicators
Source organization:
ILO Key Indicators of the Labour Market (KILM).
Categories, topics:
Social Protection & Labor
Last updated:
apr 23, 2017
Indicators value changes by year
At the date of observation
Value
Absolute change
Change from previous value
jan 1, 1994
4.45
+4.45
0.0%
jan 1, 1996
4.625
+0.176
3.95%
jan 1, 1997
4.42
-0.206
-4.44%
jan 1, 2001
3.632
-0.788
-17.82%
jan 1, 2002
4.573
+0.941
25.9%
jan 1, 2003
4.361
-0.212
-4.64%
jan 1, 2004
4.443
+0.083
1.9%
jan 1, 2005
4.504
+0.06
1.36%
jan 1, 2006
4.547
+0.043
0.96%
jan 1, 2007
4.643
+0.096
2.12%
jan 1, 2008
4.244
-0.399
-8.6%
jan 1, 2009
4.592
+0.349
8.22%
jan 1, 2010
4.489
-0.103
-2.25%
jan 1, 2012
3.862
-0.627
-13.98%
jan 1, 2013
3.996
+0.134
3.47%
Ranking of countries by current statistics by years


Comments: