29
/
en
AIzaSyAYiBZKx7MnpbEhh9jyipgxe19OcubqV5w
April 1, 2024
29776
Euro area
EMU
false
2
1
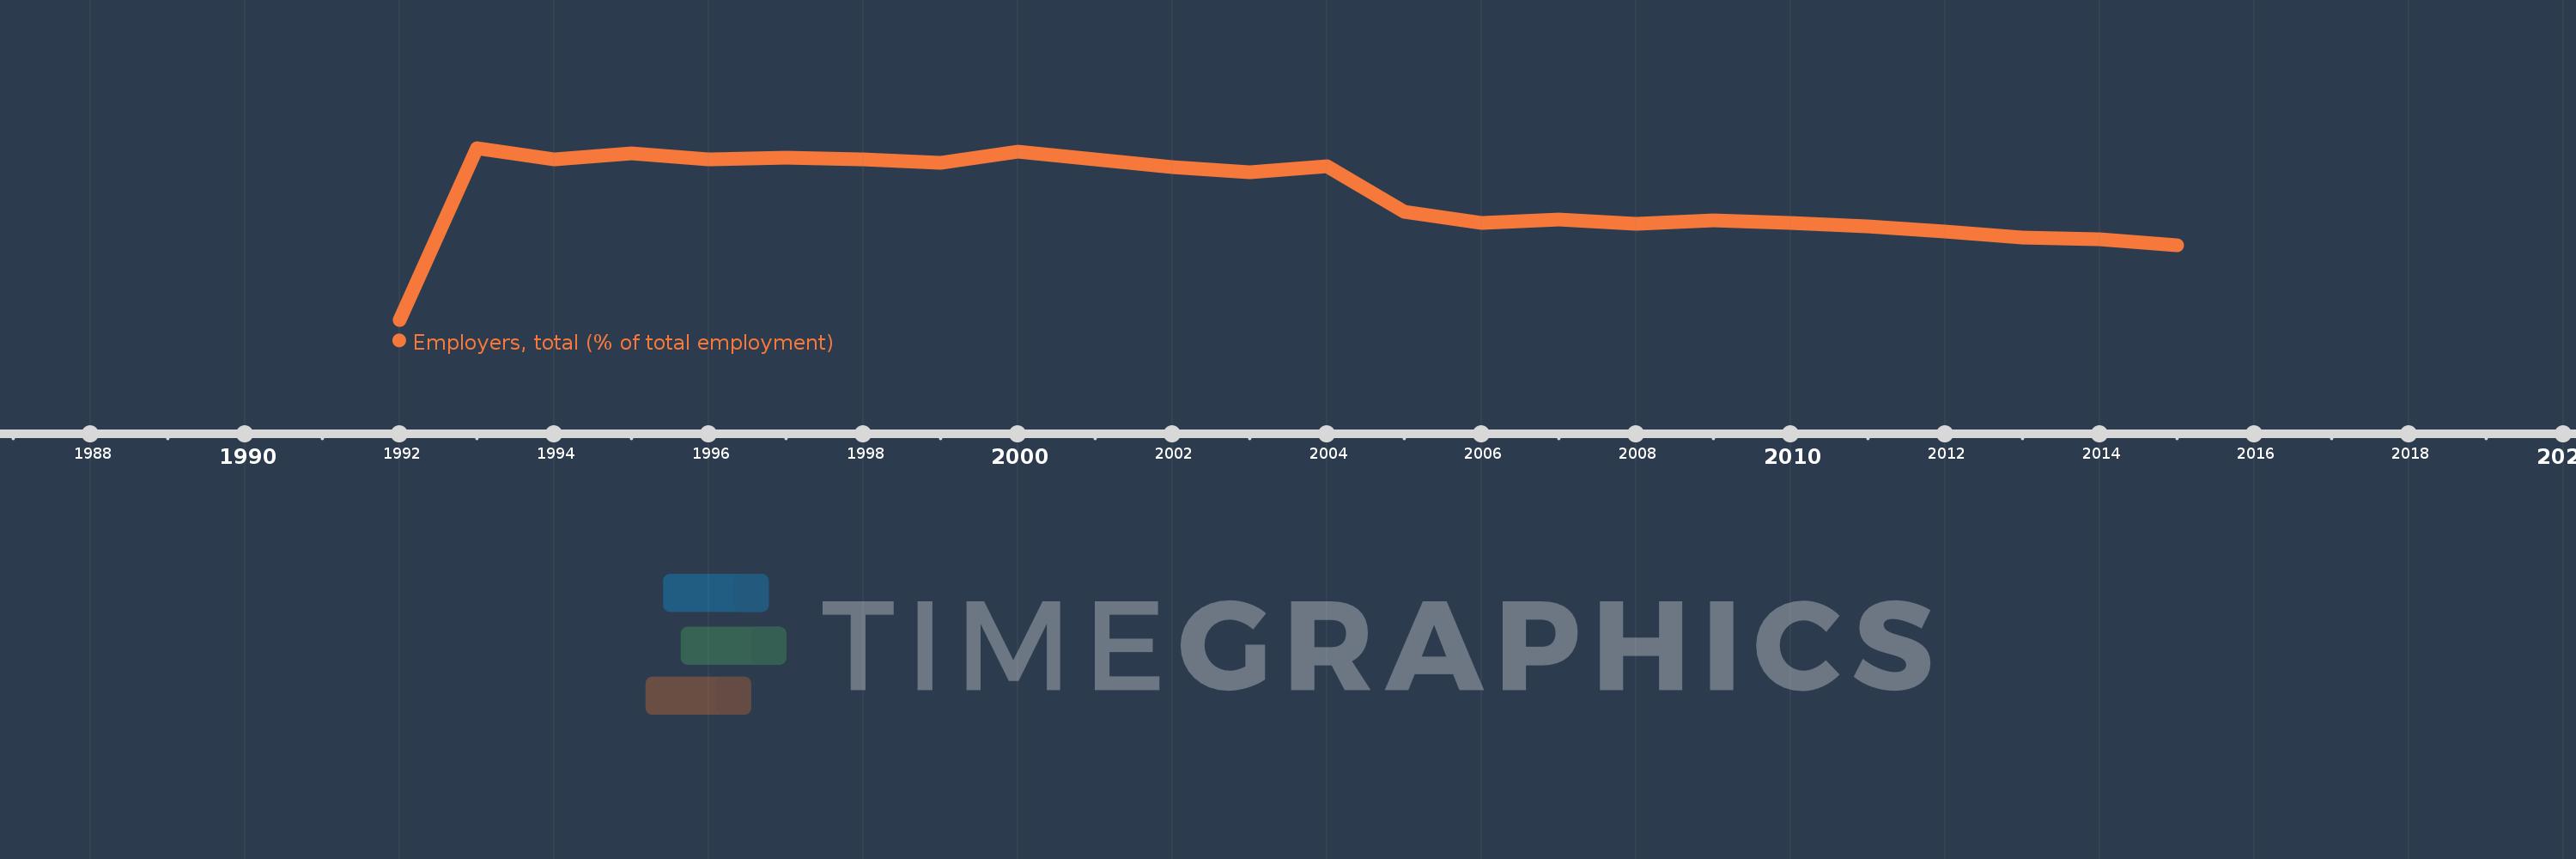
Employers, total (% of total employment)
2015,2014,2013,2012,2011,2010,2009,2008,2007,2006,2005,2004,2003,2002,2001,2000,1999,1998,1997,1996,1995,1994,1993,1992
This statistics in other country:
Timeline:
This timeline shows a graph from 1992 to 2015 of Euro area. No data until 1991. Number of actual observations by date: 24.
Source name:
World Development Indicators
Source organization:
ILO Key Indicators of the Labour Market (KILM).
Categories, topics:
Social Protection & Labor
Last updated:
apr 23, 2017
Indicators value changes by year
At the date of observation
Value
Absolute change
Change from previous value
jan 1, 1992
3.757
+3.757
0.0%
jan 1, 1993
6.237
+2.48
66.01%
jan 1, 1994
6.076
-0.16
-2.57%
jan 1, 1995
6.164
+0.088
1.44%
jan 1, 1996
6.07
-0.094
-1.52%
jan 1, 1997
6.096
+0.026
0.42%
jan 1, 1998
6.073
-0.023
-0.38%
jan 1, 1999
6.025
-0.048
-0.79%
jan 1, 2000
6.188
+0.163
2.7%
jan 1, 2001
6.074
-0.113
-1.83%
jan 1, 2002
5.962
-0.112
-1.85%
jan 1, 2003
5.887
-0.074
-1.25%
jan 1, 2004
5.968
+0.08
1.37%
jan 1, 2005
5.311
-0.657
-11.01%
jan 1, 2006
5.158
-0.153
-2.87%
jan 1, 2007
5.2
+0.042
0.81%
jan 1, 2008
5.143
-0.057
-1.1%
jan 1, 2009
5.197
+0.054
1.05%
jan 1, 2010
5.151
-0.046
-0.88%
jan 1, 2011
5.11
-0.041
-0.8%
jan 1, 2012
5.025
-0.085
-1.67%
jan 1, 2013
4.941
-0.083
-1.66%
jan 1, 2014
4.925
-0.016
-0.33%
jan 1, 2015
4.833
-0.092
-1.86%
Ranking of countries by current statistics by years


Comments: