29
/
en
AIzaSyAYiBZKx7MnpbEhh9jyipgxe19OcubqV5w
April 1, 2024
199025
Mongolia
MNG
true
2
1
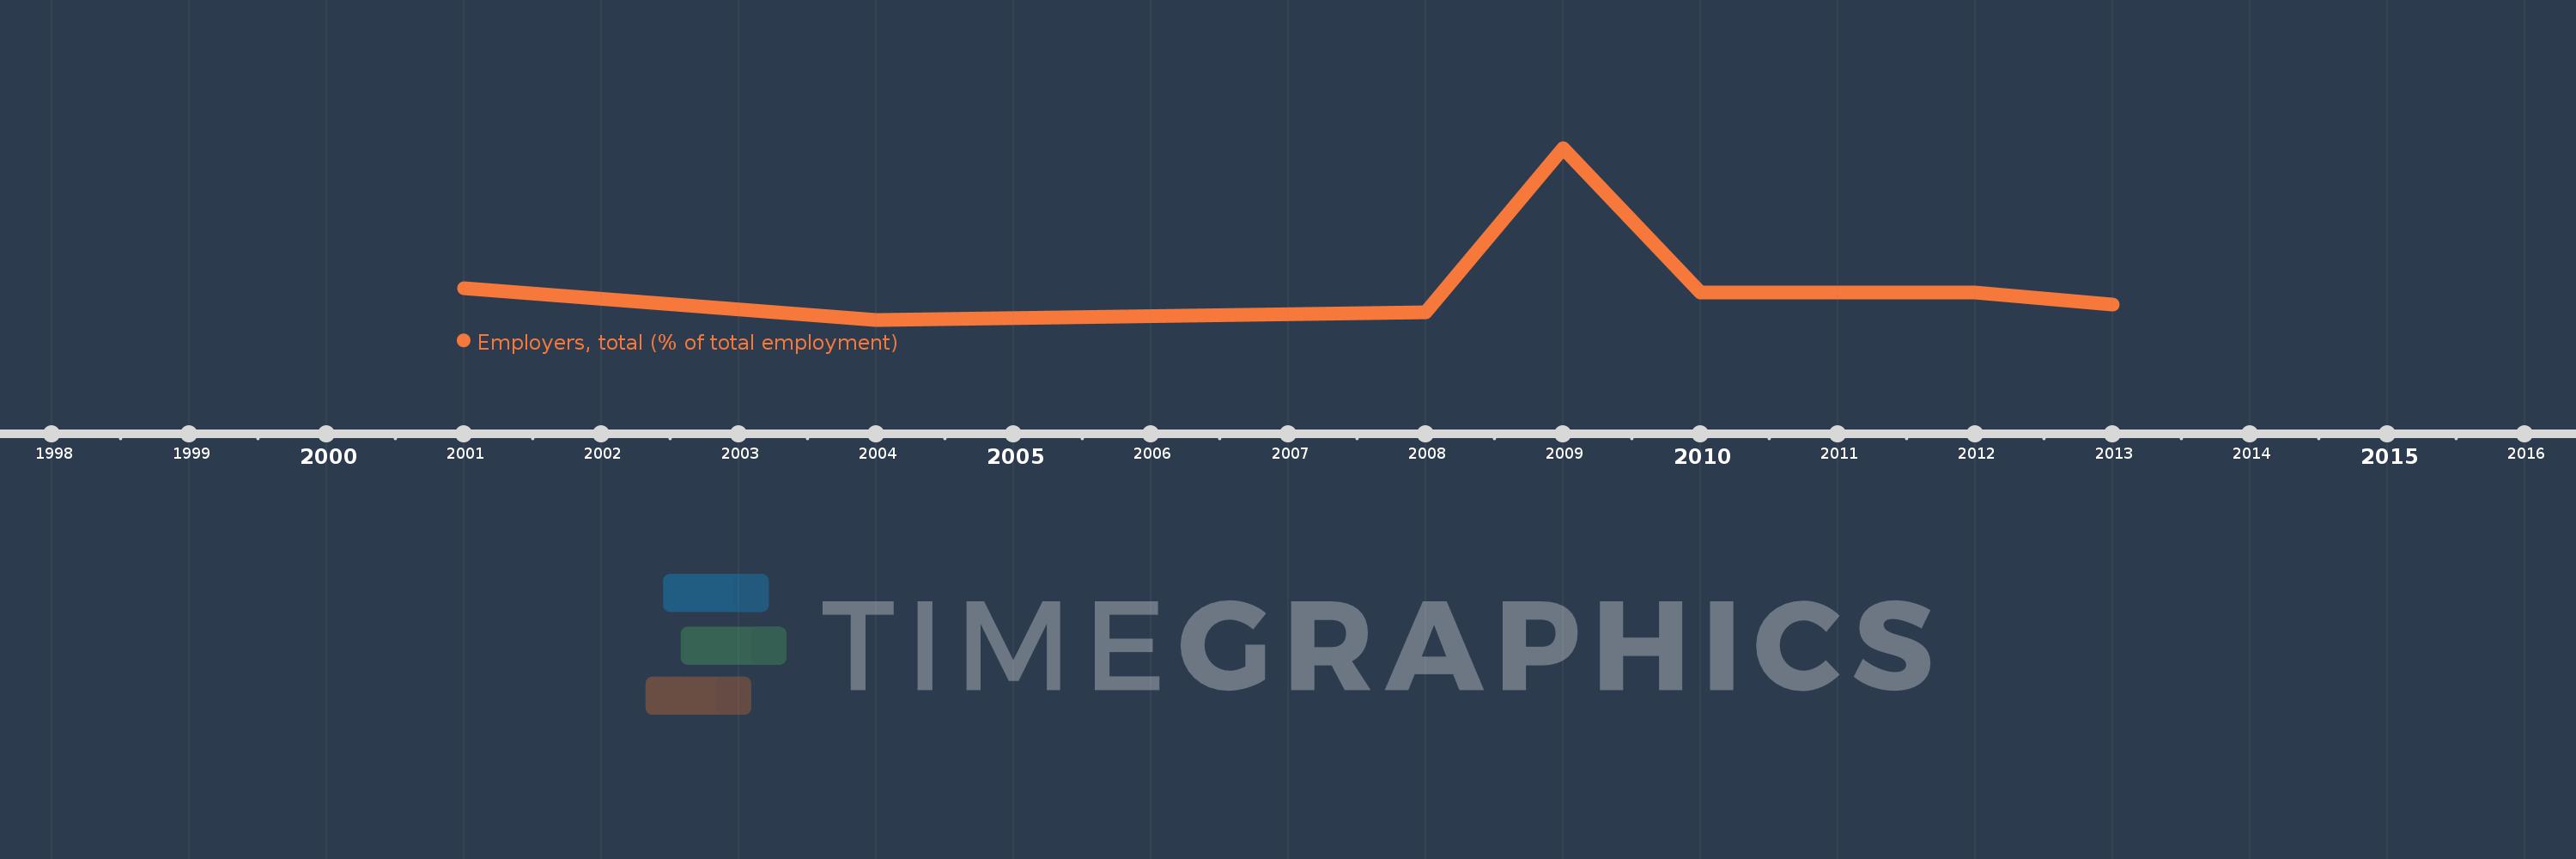
Employers, total (% of total employment)
2013,2012,2011,2010,2009,2008,2004,2001
This statistics in other country:
Timeline:
This timeline shows a graph from 2001 to 2013 of Mongolia. No data until 2000. Number of actual observations by date: 8.
Source name:
World Development Indicators
Source organization:
ILO Key Indicators of the Labour Market (KILM).
Categories, topics:
Social Protection & Labor
Last updated:
apr 23, 2017
Indicators value changes by year
At the date of observation
Value
Absolute change
Change from previous value
jan 1, 2004
0.5
-0.8
-61.54%
jan 1, 2008
0.7
+0.2
40.0%
jan 1, 2009
4.9
+4.2
600.0%
jan 1, 2010
1.2
-3.7
-75.51%
jan 1, 2013
0.9
-0.3
-25.0%
Ranking of countries by current statistics by years


Comments: