29
/
en
AIzaSyAYiBZKx7MnpbEhh9jyipgxe19OcubqV5w
April 1, 2024
30598
Europe & Central Asia
ECS
false
2
1
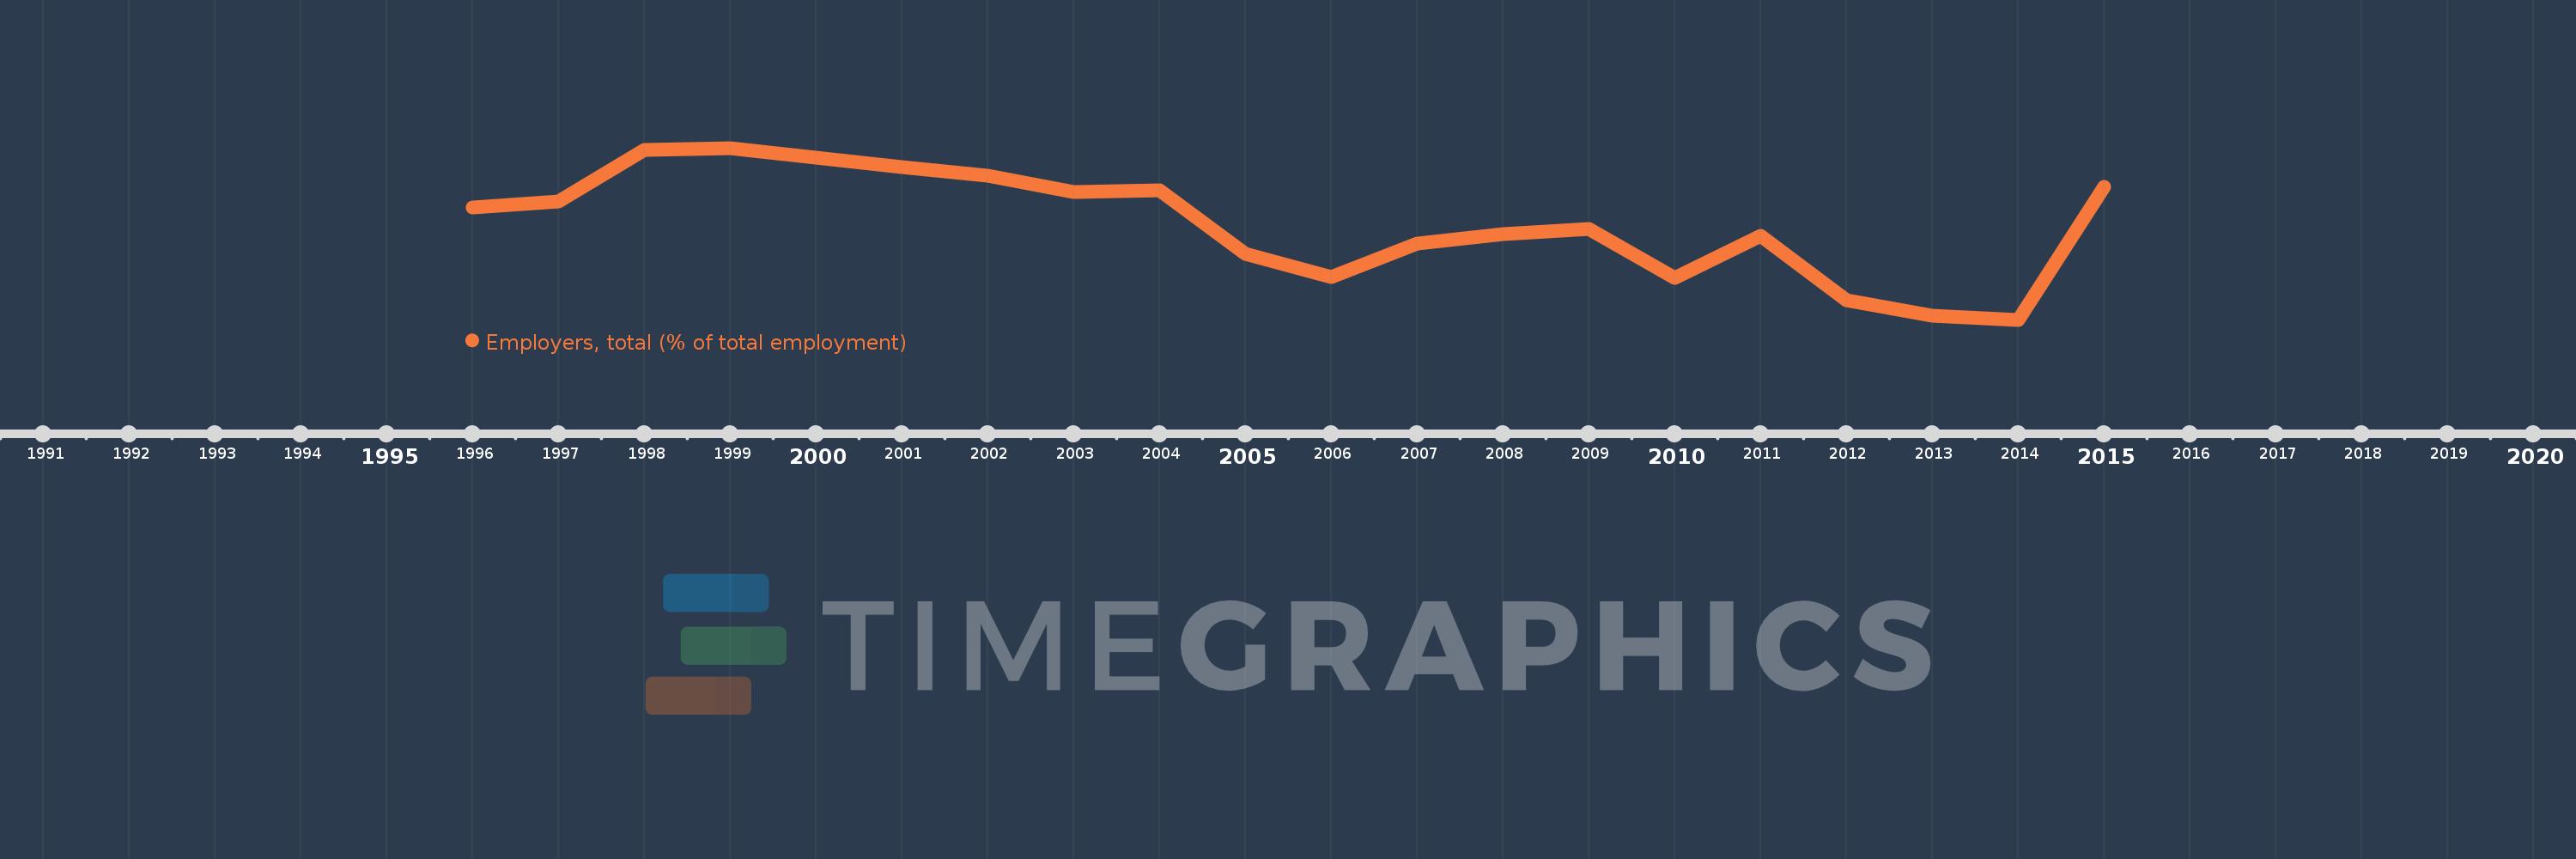
Employers, total (% of total employment)
2015,2014,2013,2012,2011,2010,2009,2008,2007,2006,2005,2004,2003,2002,2001,2000,1999,1998,1997,1996
This statistics in other country:
Timeline:
This timeline shows a graph from 1996 to 2015 of Europe & Central Asia. No data until 1995. Number of actual observations by date: 20.
Source name:
World Development Indicators
Source organization:
ILO Key Indicators of the Labour Market (KILM).
Categories, topics:
Social Protection & Labor
Last updated:
apr 23, 2017
Indicators value changes by year
At the date of observation
Value
Absolute change
Change from previous value
jan 1, 1996
3.935
+3.935
0.0%
jan 1, 1997
3.956
+0.022
0.55%
jan 1, 1998
4.16
+0.204
5.16%
jan 1, 1999
4.167
+0.007
0.16%
jan 1, 2000
4.129
-0.038
-0.91%
jan 1, 2001
4.093
-0.036
-0.88%
jan 1, 2002
4.059
-0.033
-0.82%
jan 1, 2003
3.993
-0.066
-1.64%
jan 1, 2004
4.003
+0.011
0.26%
jan 1, 2005
3.753
-0.251
-6.26%
jan 1, 2006
3.663
-0.089
-2.38%
jan 1, 2007
3.792
+0.128
3.5%
jan 1, 2008
3.83
+0.039
1.02%
jan 1, 2009
3.851
+0.021
0.55%
jan 1, 2010
3.659
-0.192
-4.99%
jan 1, 2011
3.823
+0.164
4.49%
jan 1, 2012
3.571
-0.252
-6.6%
jan 1, 2013
3.512
-0.059
-1.66%
jan 1, 2014
3.495
-0.017
-0.49%
jan 1, 2015
4.016
+0.522
14.93%
Ranking of countries by current statistics by years


Comments: