29
/
en
AIzaSyAYiBZKx7MnpbEhh9jyipgxe19OcubqV5w
April 1, 2024
31907
Europe & Central Asia (excluding high income)
ECA
false
2
1
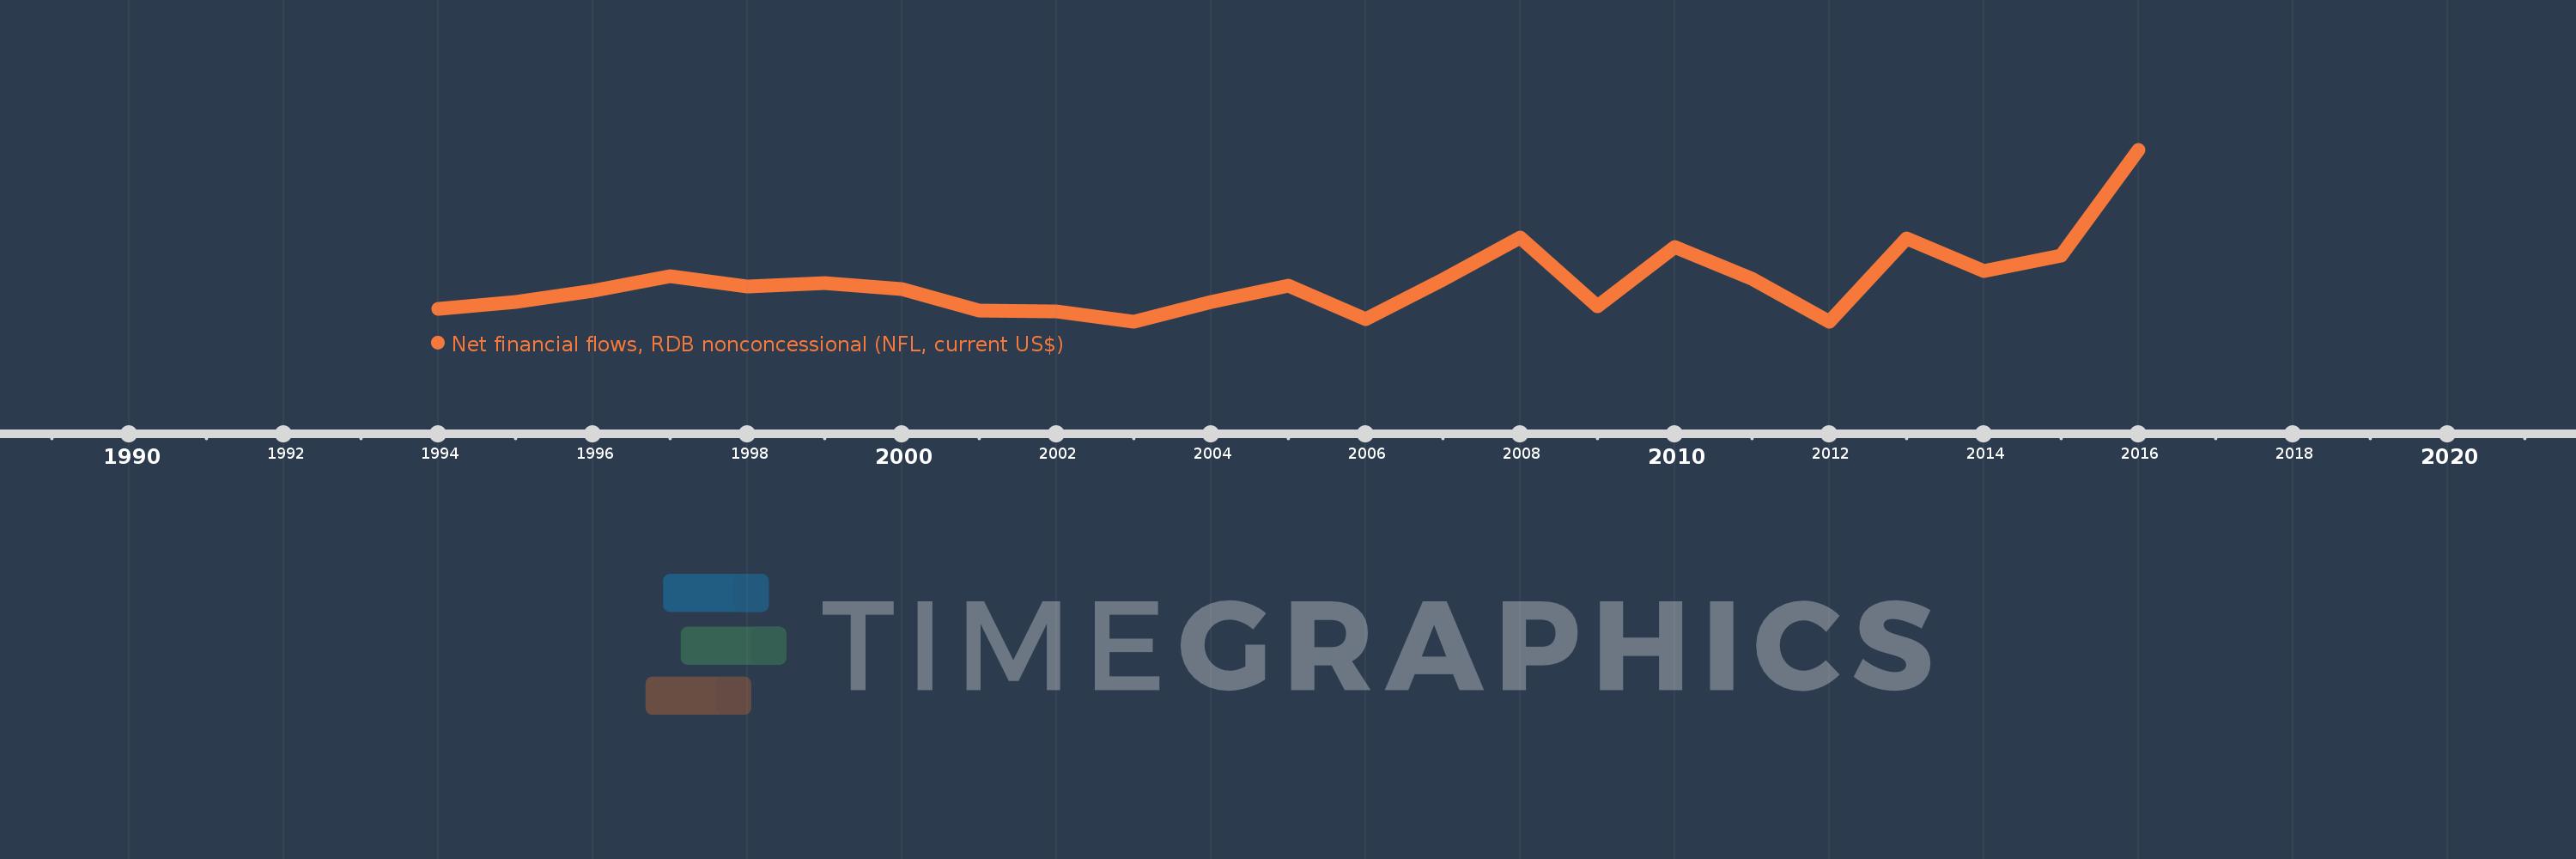
Net financial flows, RDB nonconcessional (NFL, current US$)
2016,2015,2014,2013,2012,2011,2010,2009,2008,2007,2006,2005,2004,2003,2002,2001,2000,1999,1998,1997,1996,1995,1994
This statistics in other country:
Timeline:
This timeline shows a graph from 1994 to 2016 of Europe & Central Asia (excluding high income). No data until 1993. Number of actual observations by date: 23.
Source name:
World Development Indicators
Source organization:
World Bank, International Debt Statistics.
Categories, topics:
External Debt
Last updated:
apr 23, 2017
Indicators value changes by year
Minimum:
-79.885 mln
jan 1, 2012
Maximum:
1.904 bln
jan 1, 2016
At the date of observation
Value
Absolute change
Change from previous value
jan 1, 1994
67.18 mln
+67.18 mln
0.0%
jan 1, 1995
151.633 mln
+84.453 mln
125.71%
jan 1, 1996
275.552 mln
+123.919 mln
81.72%
jan 1, 1997
444.104 mln
+168.552 mln
61.17%
jan 1, 1998
330.215 mln
-113.889 mln
-25.64%
jan 1, 1999
372.498 mln
+42.283 mln
12.8%
jan 1, 2000
297.519 mln
-74.979 mln
-20.13%
jan 1, 2001
49.22 mln
-248.299 mln
-83.46%
jan 1, 2002
39.392 mln
-9.828 mln
-19.97%
jan 1, 2003
-76.25 mln
-115.642 mln
-293.57%
jan 1, 2004
153.684 mln
+229.934 mln
-301.55%
jan 1, 2005
340.03 mln
+186.346 mln
121.25%
jan 1, 2006
-44.503 mln
-384.533 mln
-113.09%
jan 1, 2007
404.726 mln
+449.229 mln
-1.01K%
jan 1, 2008
891.429 mln
+486.703 mln
120.25%
jan 1, 2009
105.702 mln
-785.727 mln
-88.14%
jan 1, 2010
789.18 mln
+683.478 mln
646.61%
jan 1, 2011
416.726 mln
-372.454 mln
-47.2%
jan 1, 2012
-79.885 mln
-496.611 mln
-119.17%
jan 1, 2013
881.882 mln
+961.767 mln
-1.2K%
jan 1, 2014
505.743 mln
-376.139 mln
-42.65%
jan 1, 2015
685.848 mln
+180.105 mln
35.61%
jan 1, 2016
1.904 bln
+1.218 bln
177.61%
Ranking of countries by current statistics by years


Comments: