29
/
en
AIzaSyAYiBZKx7MnpbEhh9jyipgxe19OcubqV5w
April 1, 2024
174463
Lao PDR
LAO
true
2
1
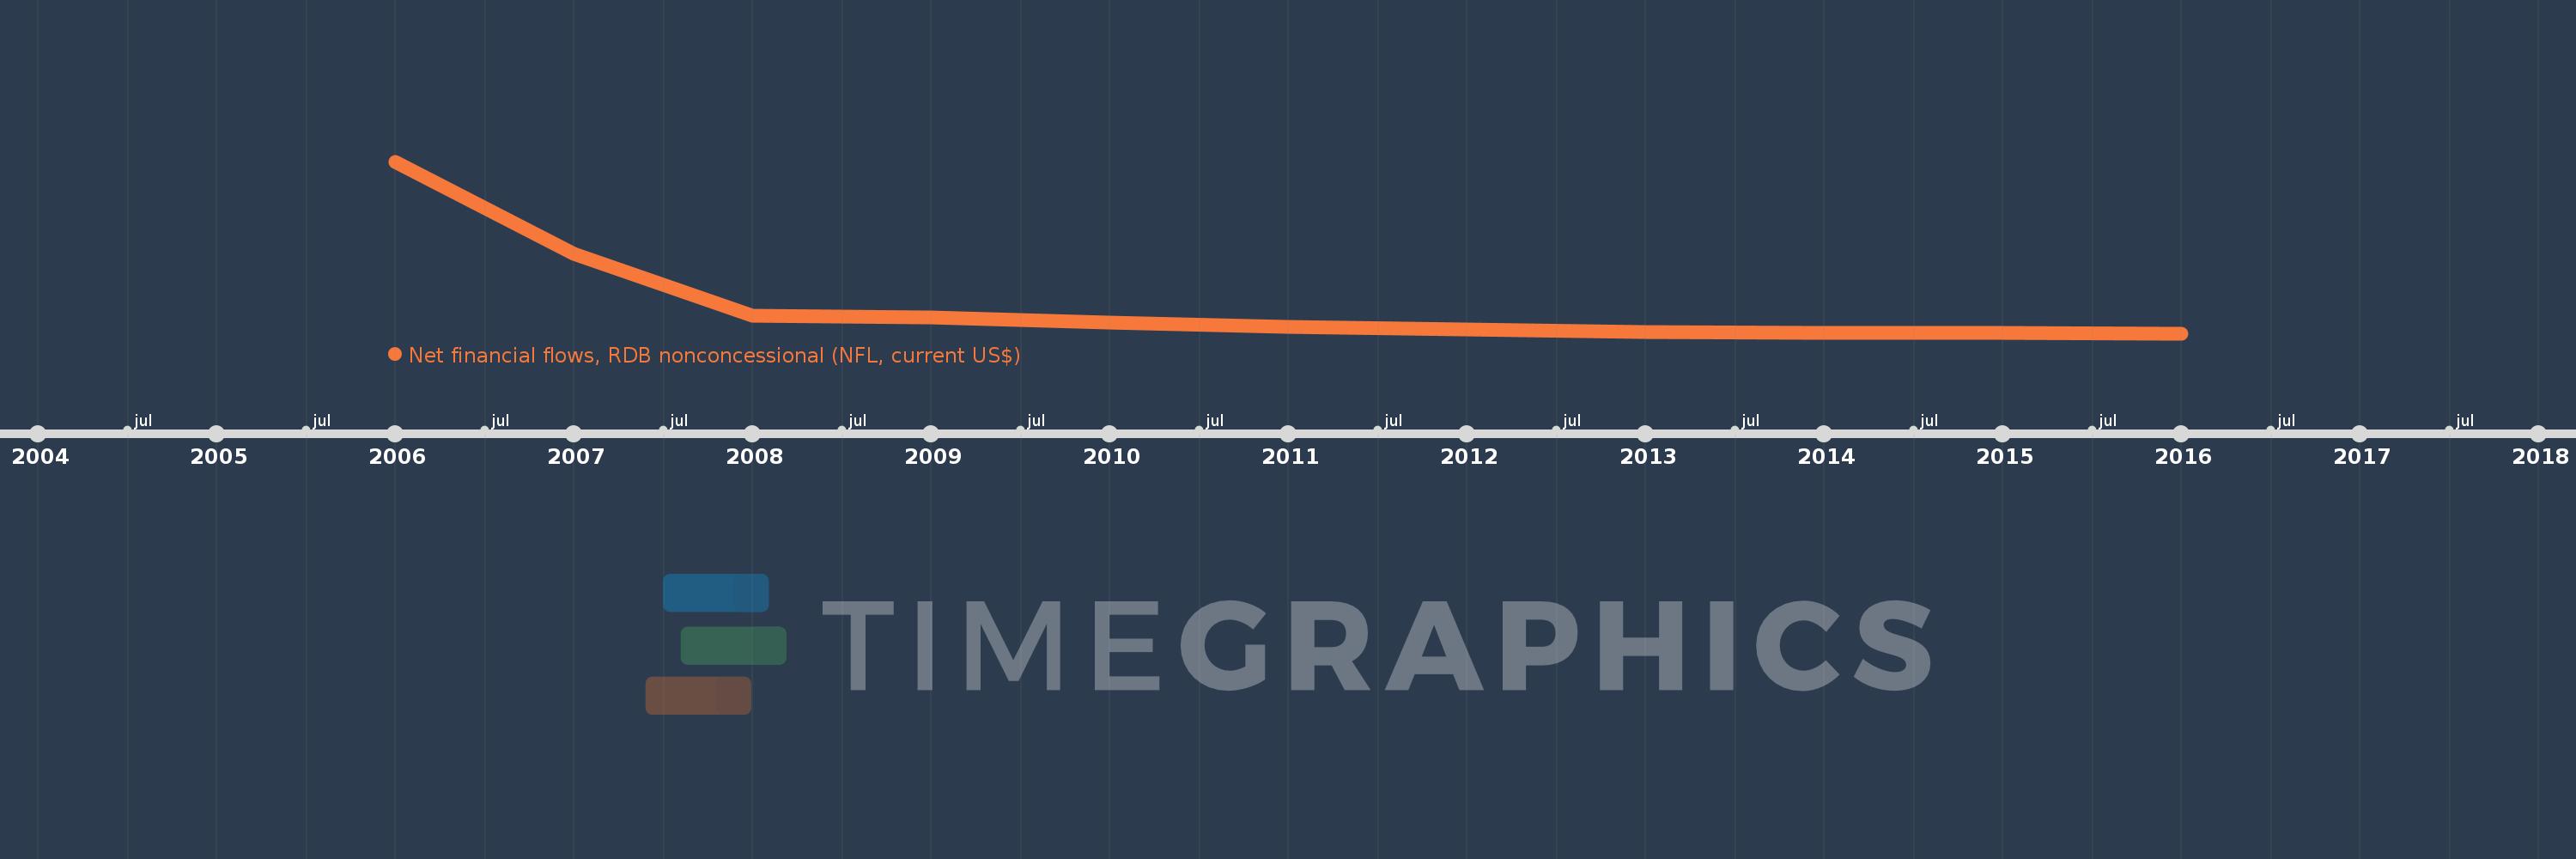
Net financial flows, RDB nonconcessional (NFL, current US$)
2016,2015,2014,2013,2012,2011,2010,2009,2008,2007,2006
This statistics in other country:
Timeline:
This timeline shows a graph from 2006 to 2016 of Lao PDR. No data until 2005. Number of actual observations by date: 11.
Source name:
World Development Indicators
Source organization:
World Bank, International Debt Statistics.
Categories, topics:
External Debt
Last updated:
apr 23, 2017
Indicators value changes by year
Minimum:
-284.0K
jan 1, 2016
Maximum:
11.101 mln
jan 1, 2006
At the date of observation
Value
Absolute change
Change from previous value
jan 1, 2006
11.101 mln
+11.101 mln
0.0%
jan 1, 2007
4.989 mln
-6.112 mln
-55.06%
jan 1, 2008
909.0K
-4.08 mln
-81.78%
jan 1, 2009
744.0K
-165.0K
-18.15%
jan 1, 2010
451.0K
-293.0K
-39.38%
jan 1, 2011
152.0K
-299.0K
-66.3%
jan 1, 2012
-17.0K
-169.0K
-111.18%
jan 1, 2013
-212.0K
-195.0K
1.15K%
jan 1, 2014
-234.0K
-22.0K
10.38%
jan 1, 2015
-256.0K
-22.0K
9.4%
jan 1, 2016
-284.0K
-28.0K
10.94%
Ranking of countries by current statistics by years


Comments: