29
/
en
AIzaSyAYiBZKx7MnpbEhh9jyipgxe19OcubqV5w
April 1, 2024
231413
Rwanda
RWA
true
2
1
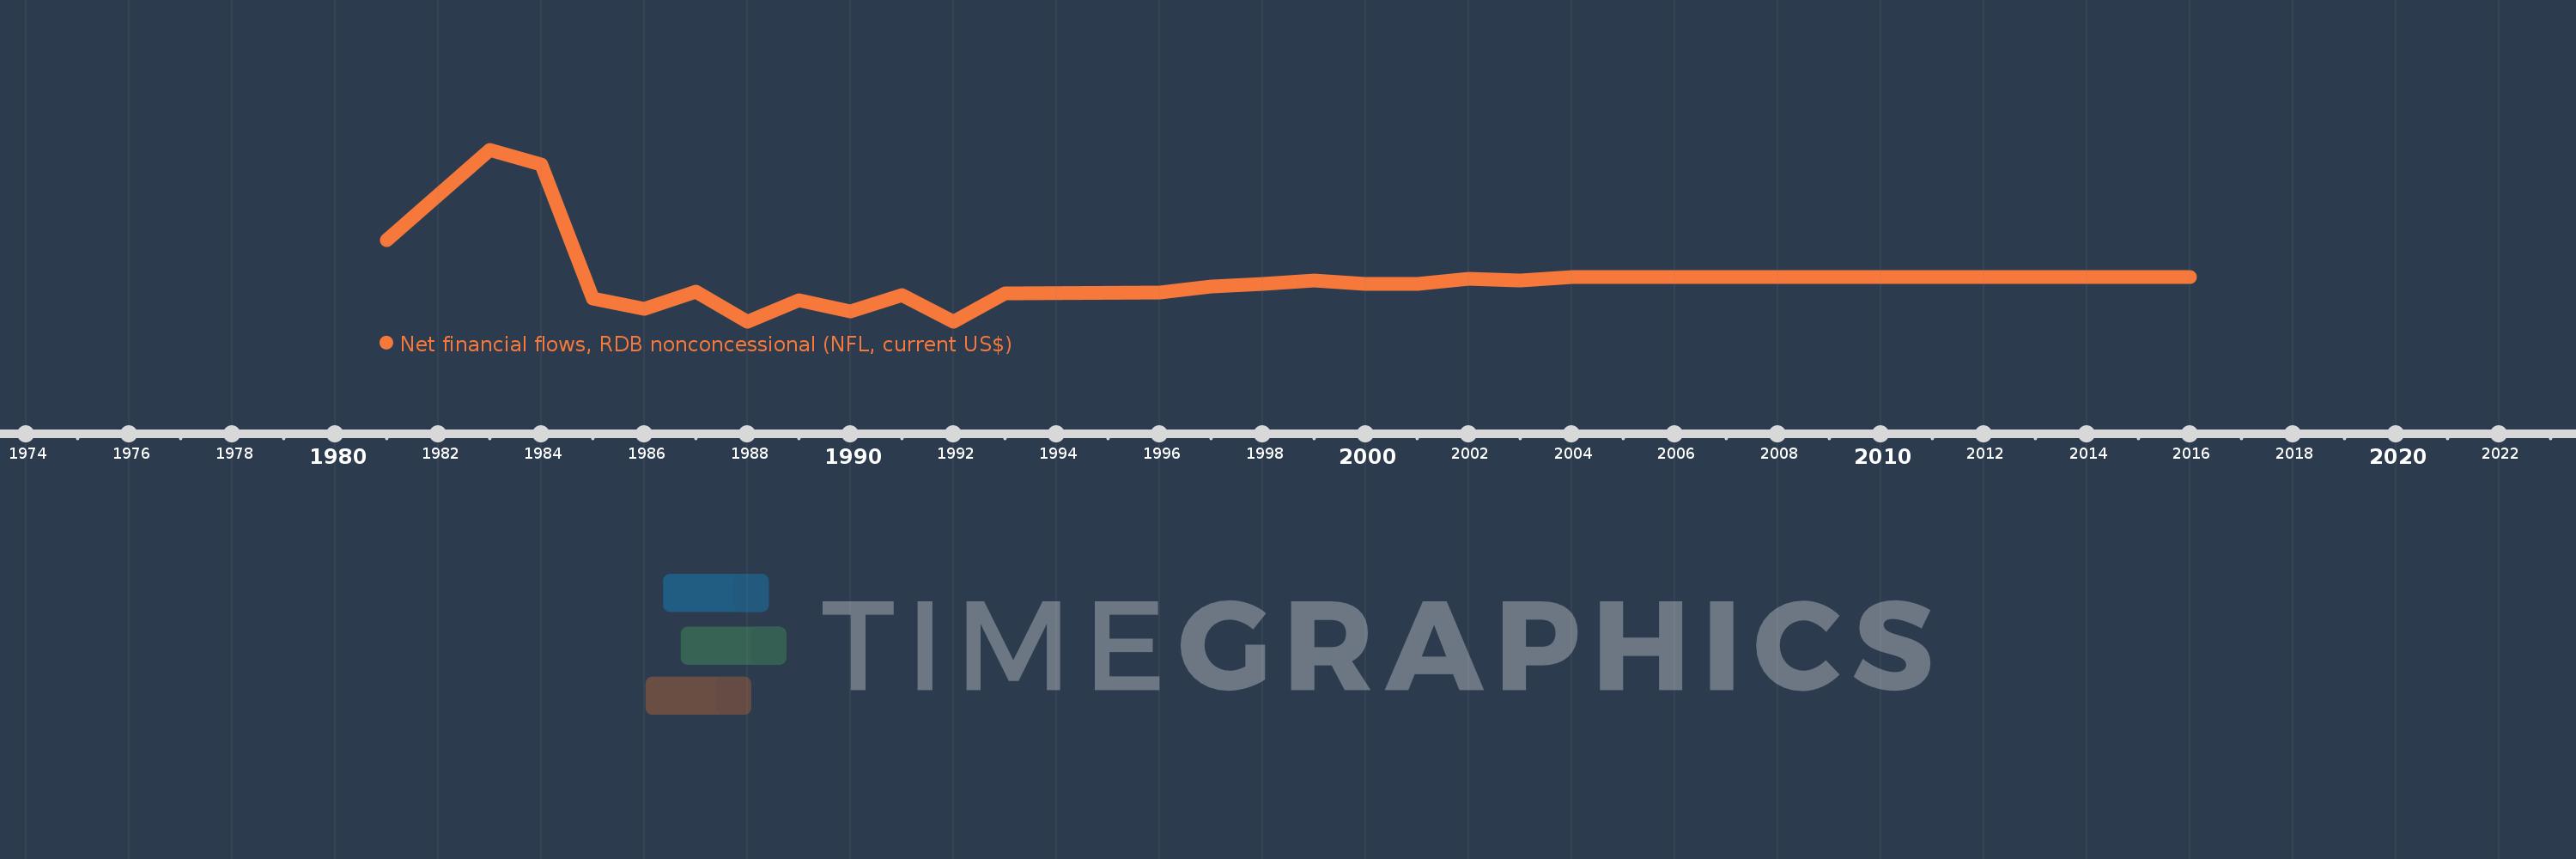
Net financial flows, RDB nonconcessional (NFL, current US$)
2016,2015,2004,2003,2002,2001,2000,1999,1998,1997,1996,1993,1992,1991,1990,1989,1988,1987,1986,1985,1984,1983,1981
This statistics in other country:
Timeline:
This timeline shows a graph from 1981 to 2016 of Rwanda. No data until 1980. Number of actual observations by date: 23.
Source name:
World Development Indicators
Source organization:
World Bank, International Debt Statistics.
Categories, topics:
External Debt
Last updated:
apr 23, 2017
Indicators value changes by year
Minimum:
-342.0K
jan 1, 1988
Maximum:
978.0K
jan 1, 1983
At the date of observation
Value
Absolute change
Change from previous value
jan 1, 1981
285.0K
+285.0K
0.0%
jan 1, 1983
978.0K
+693.0K
243.16%
jan 1, 1984
870.0K
-108.0K
-11.04%
jan 1, 1985
-159.0K
-1.029 mln
-118.28%
jan 1, 1986
-239.0K
-80.0K
50.31%
jan 1, 1987
-107.0K
+132.0K
-55.23%
jan 1, 1988
-342.0K
-235.0K
219.63%
jan 1, 1989
-176.0K
+166.0K
-48.54%
jan 1, 1990
-259.0K
-83.0K
47.16%
jan 1, 1991
-136.0K
+123.0K
-47.49%
jan 1, 1992
-339.0K
-203.0K
149.26%
jan 1, 1993
-122.0K
+217.0K
-64.01%
jan 1, 1996
-115.0K
+7.0K
-5.74%
jan 1, 1997
-70.0K
+45.0K
-39.13%
jan 1, 1998
-47.0K
+23.0K
-32.86%
jan 1, 1999
-24.0K
+23.0K
-48.94%
jan 1, 2000
-47.0K
-23.0K
95.83%
jan 1, 2001
-51.0K
-4.0K
8.51%
jan 1, 2002
-8.0K
+43.0K
-84.31%
jan 1, 2003
-21.0K
-13.0K
162.5%
jan 1, 2004
0.0
+21.0K
-100.0%
Ranking of countries by current statistics by years


Comments: