29
/
en
AIzaSyAYiBZKx7MnpbEhh9jyipgxe19OcubqV5w
April 1, 2024
71525
Armenia
ARM
true
2
1
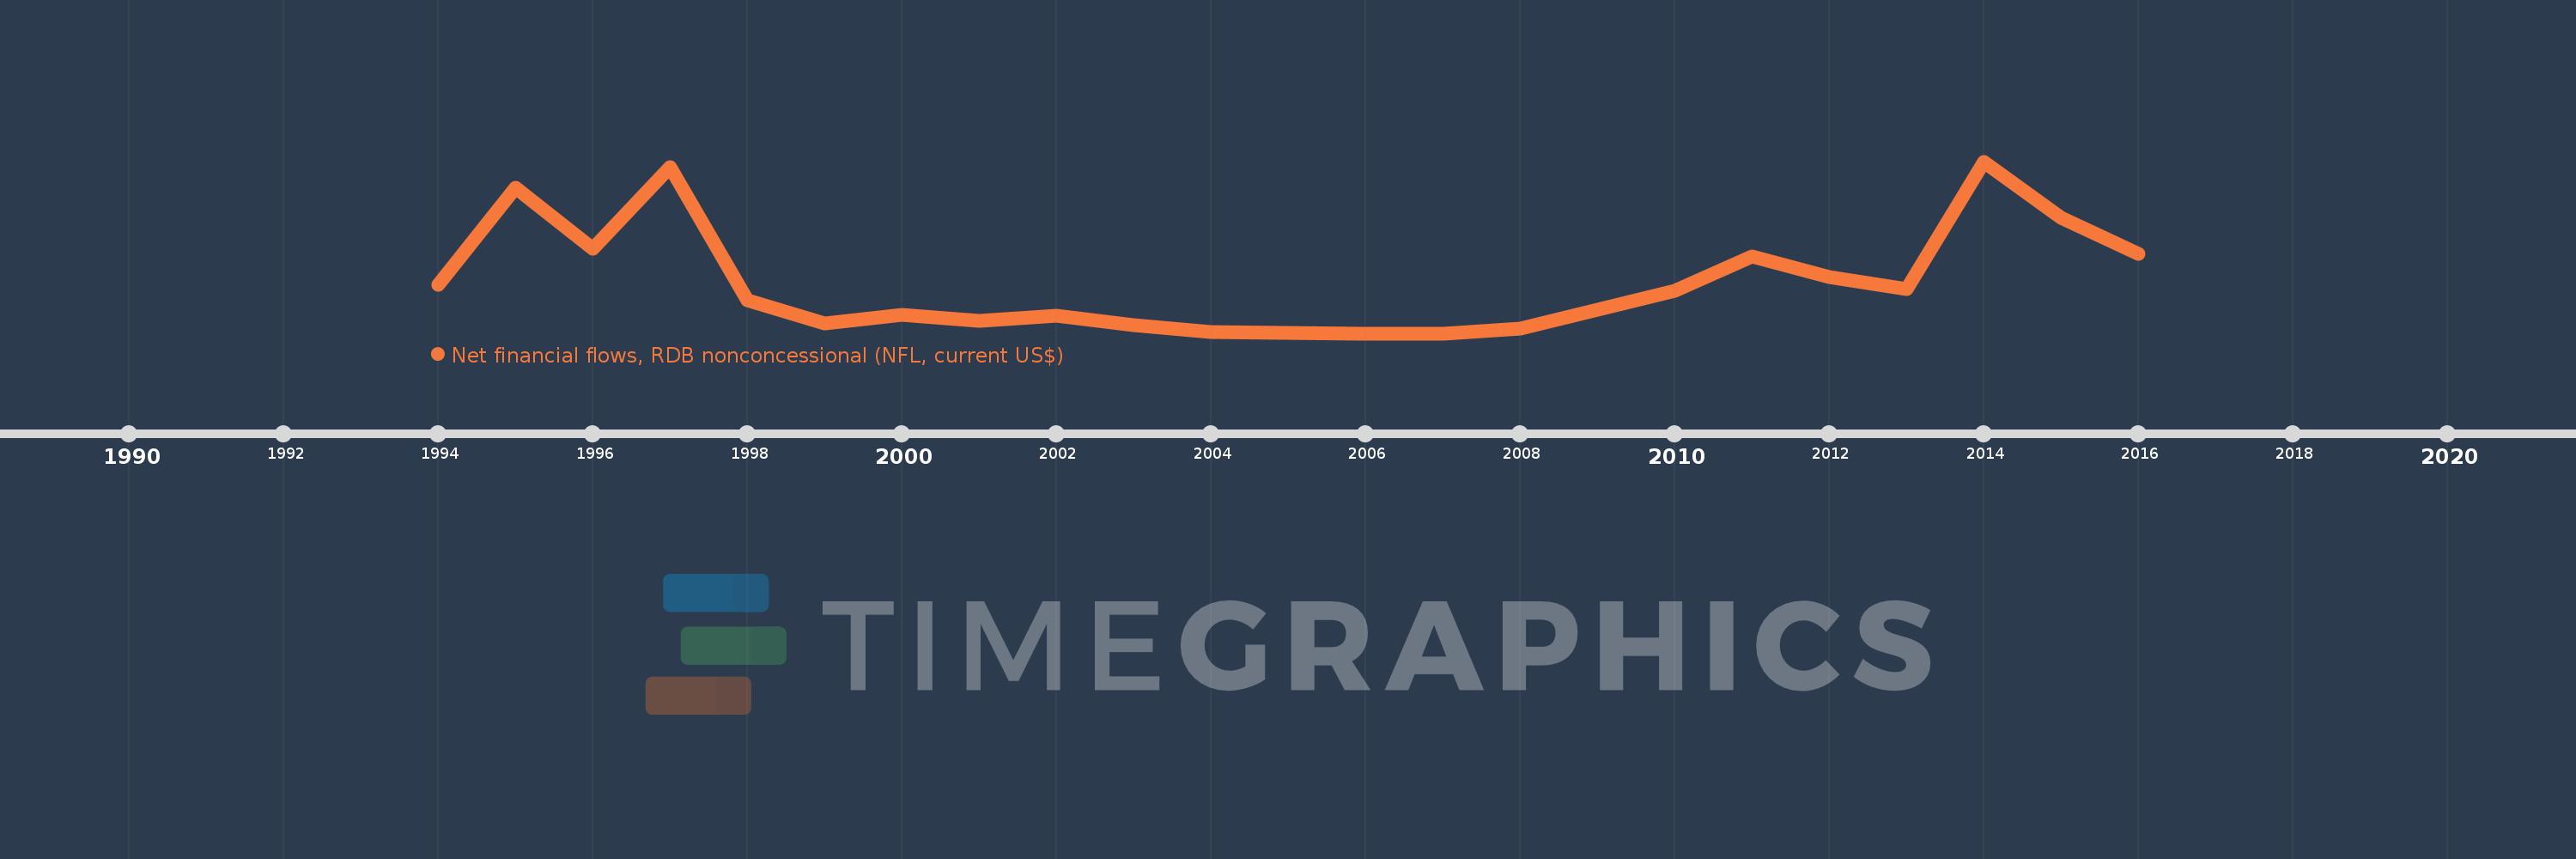
Net financial flows, RDB nonconcessional (NFL, current US$)
2016,2015,2014,2013,2012,2011,2010,2008,2007,2006,2005,2004,2003,2002,2001,2000,1999,1998,1997,1996,1995,1994
This statistics in other country:
Timeline:
This timeline shows a graph from 1994 to 2016 of Armenia. No data until 1993. Number of actual observations by date: 22.
Source name:
World Development Indicators
Source organization:
World Bank, International Debt Statistics.
Categories, topics:
External Debt
Last updated:
apr 23, 2017
Indicators value changes by year
Minimum:
-7.939 mln
jan 1, 2006
Maximum:
29.411 mln
jan 1, 2014
At the date of observation
Value
Absolute change
Change from previous value
jan 1, 1994
2.574 mln
+2.574 mln
0.0%
jan 1, 1995
23.743 mln
+21.169 mln
822.42%
jan 1, 1996
10.517 mln
-13.226 mln
-55.7%
jan 1, 1997
28.246 mln
+17.729 mln
168.57%
jan 1, 1998
-700.0K
-28.946 mln
-102.48%
jan 1, 1999
-5.78 mln
-5.08 mln
725.71%
jan 1, 2000
-3.961 mln
+1.819 mln
-31.47%
jan 1, 2001
-5.198 mln
-1.237 mln
31.23%
jan 1, 2002
-4.161 mln
+1.037 mln
-19.95%
jan 1, 2003
-6.083 mln
-1.922 mln
46.19%
jan 1, 2004
-7.645 mln
-1.562 mln
25.68%
jan 1, 2005
-7.844 mln
-199.0K
2.6%
jan 1, 2006
-7.939 mln
-95.0K
1.21%
jan 1, 2007
-7.939 mln
0.0
0.0%
jan 1, 2008
-6.891 mln
+1.048 mln
-13.2%
jan 1, 2010
1.276 mln
+8.167 mln
-118.52%
jan 1, 2011
8.746 mln
+7.47 mln
585.42%
jan 1, 2012
4.21 mln
-4.536 mln
-51.86%
jan 1, 2013
1.771 mln
-2.439 mln
-57.93%
jan 1, 2014
29.411 mln
+27.64 mln
1.56K%
jan 1, 2015
17.193 mln
-12.218 mln
-41.54%
jan 1, 2016
9.4 mln
-7.793 mln
-45.33%
Ranking of countries by current statistics by years


Comments: