29
/
en
AIzaSyAYiBZKx7MnpbEhh9jyipgxe19OcubqV5w
April 1, 2024
138402
Georgia
GEO
true
2
1
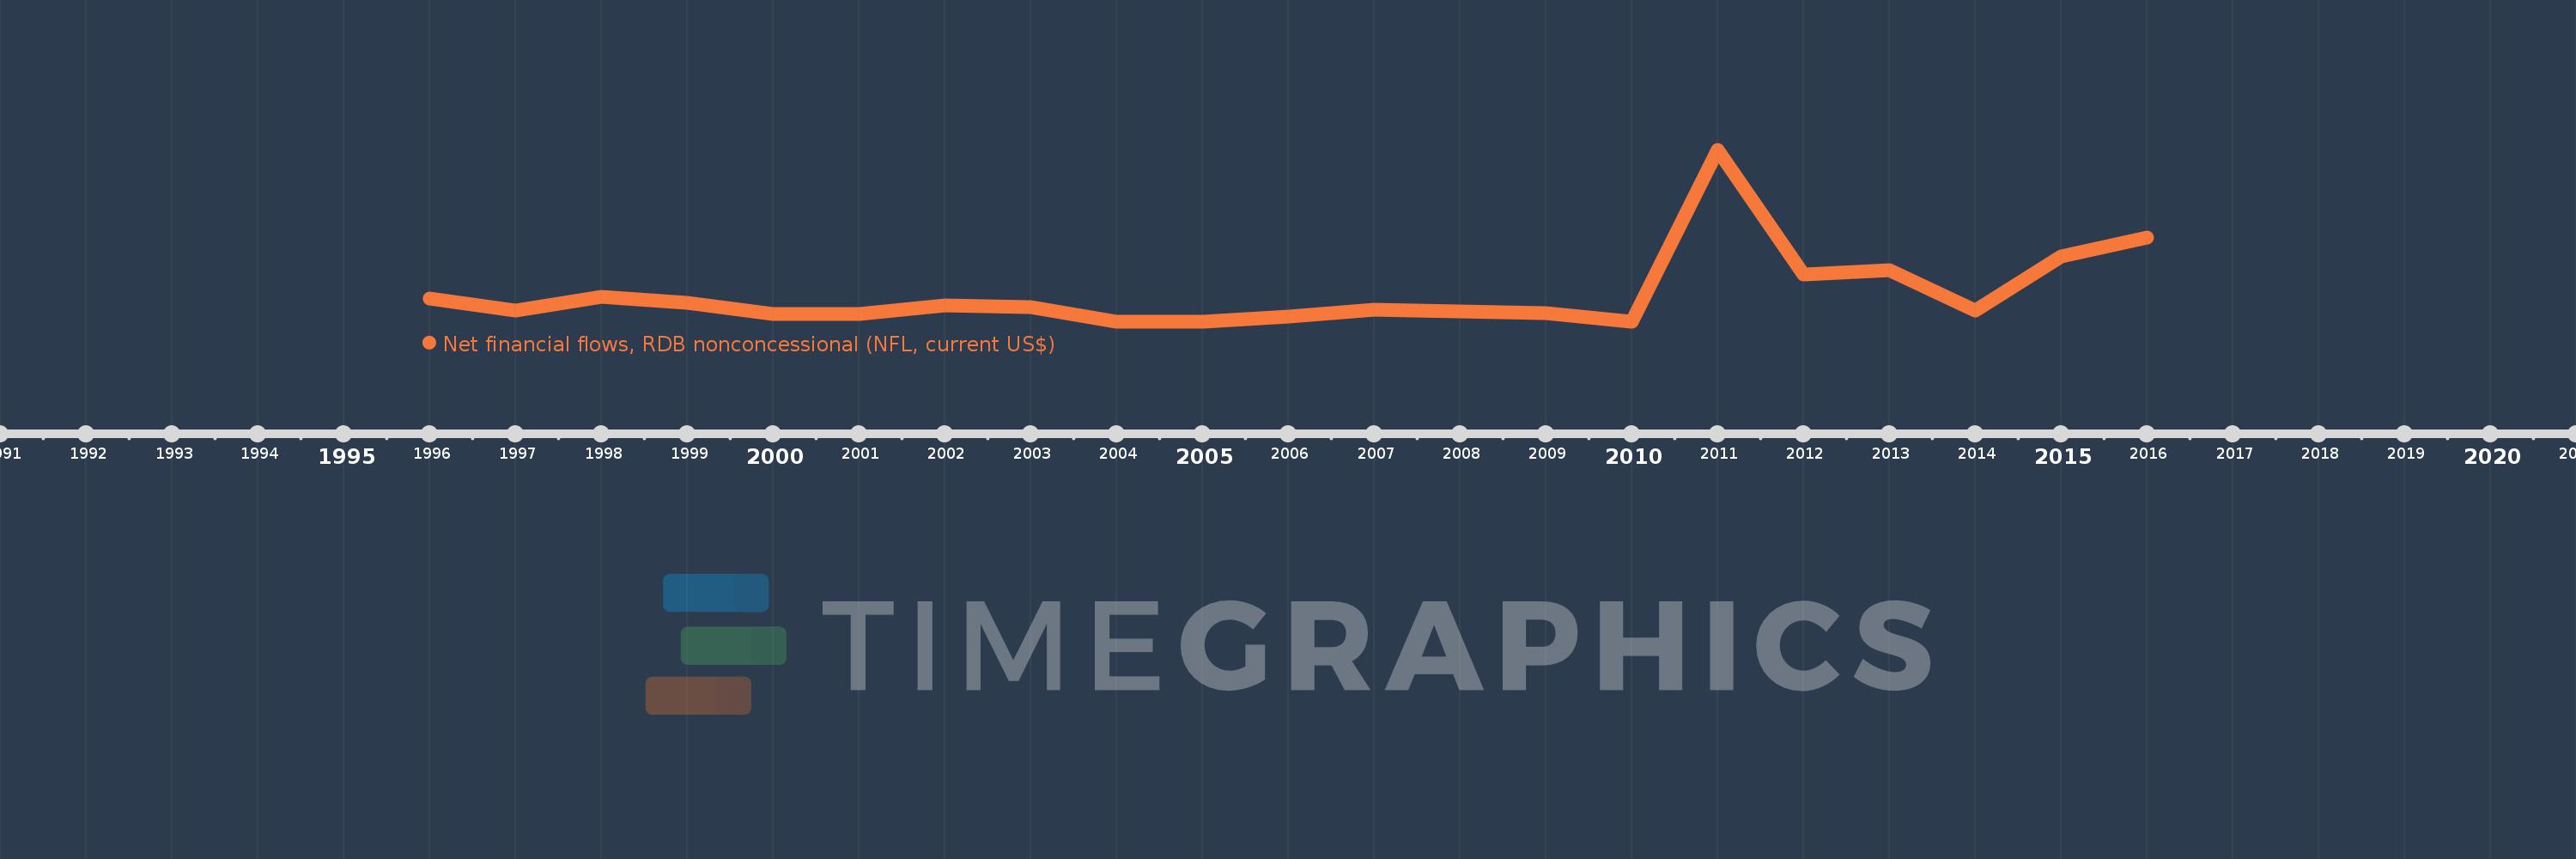
Net financial flows, RDB nonconcessional (NFL, current US$)
2016,2015,2014,2013,2012,2011,2010,2009,2008,2007,2006,2005,2004,2003,2002,2001,2000,1999,1998,1997,1996
This statistics in other country:
Timeline:
This timeline shows a graph from 1996 to 2016 of Georgia. No data until 1995. Number of actual observations by date: 21.
Source name:
World Development Indicators
Source organization:
World Bank, International Debt Statistics.
Categories, topics:
External Debt
Last updated:
apr 23, 2017
Indicators value changes by year
Minimum:
-6.182 mln
jan 1, 2004
Maximum:
118.718 mln
jan 1, 2011
At the date of observation
Value
Absolute change
Change from previous value
jan 1, 1996
11.0 mln
+11.0 mln
0.0%
jan 1, 1997
1.991 mln
-9.009 mln
-81.9%
jan 1, 1998
12.195 mln
+10.204 mln
512.51%
jan 1, 1999
7.494 mln
-4.701 mln
-38.55%
jan 1, 2000
-72.0K
-7.566 mln
-100.96%
jan 1, 2001
-119.0K
-47.0K
65.28%
jan 1, 2002
5.765 mln
+5.884 mln
-4.94K%
jan 1, 2003
4.34 mln
-1.425 mln
-24.72%
jan 1, 2004
-6.182 mln
-10.522 mln
-242.44%
jan 1, 2005
-5.936 mln
+246.0K
-3.98%
jan 1, 2006
-2.296 mln
+3.64 mln
-61.32%
jan 1, 2007
3.055 mln
+5.351 mln
-233.06%
jan 1, 2008
1.218 mln
-1.837 mln
-60.13%
jan 1, 2009
326.0K
-892.0K
-73.23%
jan 1, 2010
-5.939 mln
-6.265 mln
-1.92K%
jan 1, 2011
118.718 mln
+124.657 mln
-2.1K%
jan 1, 2012
28.658 mln
-90.06 mln
-75.86%
jan 1, 2013
31.17 mln
+2.512 mln
8.77%
jan 1, 2014
2.288 mln
-28.882 mln
-92.66%
jan 1, 2015
41.646 mln
+39.358 mln
1.72K%
jan 1, 2016
55.341 mln
+13.695 mln
32.88%
Ranking of countries by current statistics by years


Comments: