29
/
en
AIzaSyAYiBZKx7MnpbEhh9jyipgxe19OcubqV5w
April 1, 2024
31755
Europe & Central Asia (excluding high income)
ECA
false
2
1
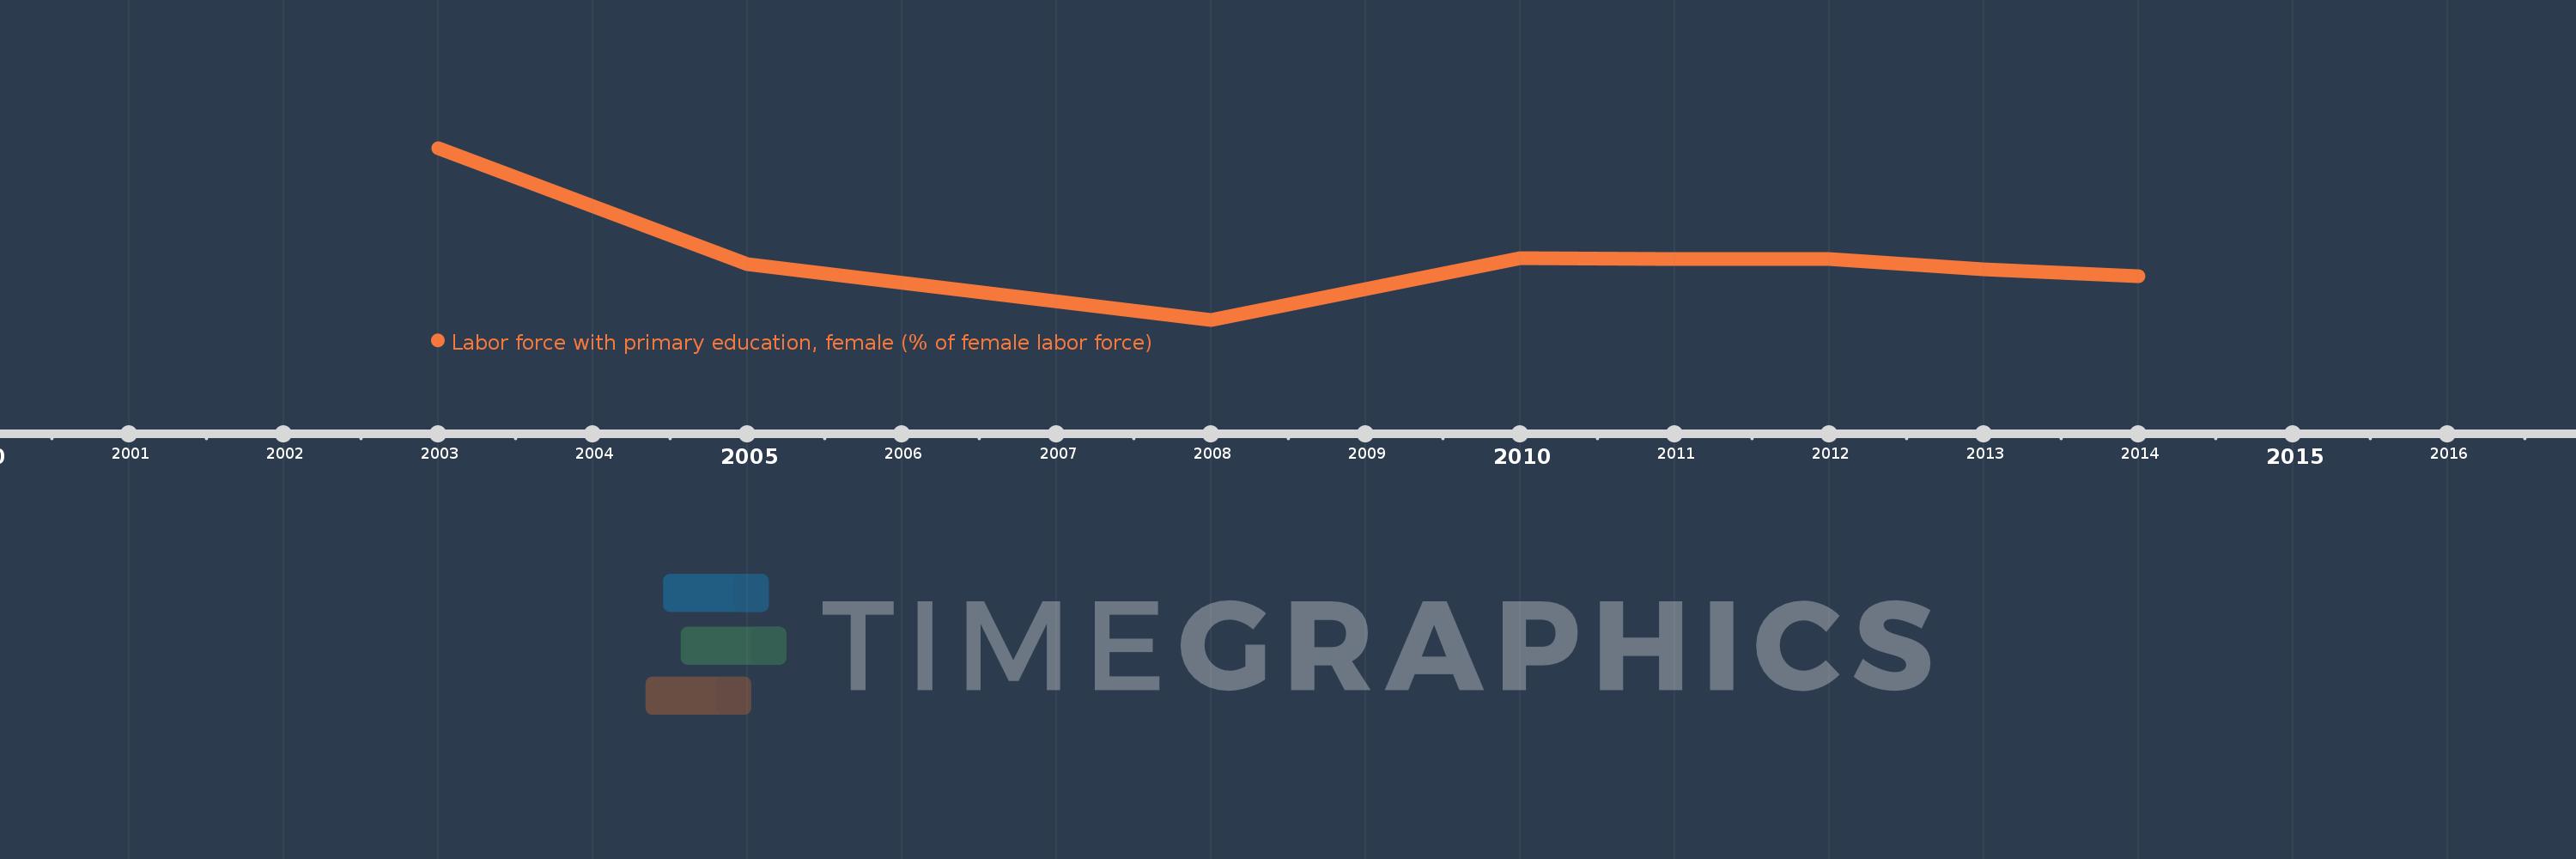
Labor force with primary education, female (% of female labor force)
2014,2013,2012,2011,2010,2008,2005,2003
This statistics in other country:
Timeline:
This timeline shows a graph from 2003 to 2014 of Europe & Central Asia (excluding high income). No data until 2002. Number of actual observations by date: 8.
Source name:
World Development Indicators
Source organization:
International Labour Organization, Key Indicators of the Labour Market database.
Categories, topics:
Education, Social Protection & Labor, Gender
Last updated:
apr 23, 2017
Indicators value changes by year
Minimum:
11.972
jan 1, 2008
Maximum:
16.984
jan 1, 2003
At the date of observation
Value
Absolute change
Change from previous value
jan 1, 2003
16.984
+16.984
0.0%
jan 1, 2005
13.589
-3.395
-19.99%
jan 1, 2008
11.972
-1.617
-11.9%
jan 1, 2010
13.762
+1.789
14.94%
jan 1, 2011
13.735
-0.027
-0.19%
jan 1, 2012
13.738
+0.003
0.02%
jan 1, 2013
13.436
-0.302
-2.2%
jan 1, 2014
13.254
-0.181
-1.35%
Ranking of countries by current statistics by years


Comments: