29
/
en
AIzaSyAYiBZKx7MnpbEhh9jyipgxe19OcubqV5w
April 1, 2024
35882
High income
HIC
false
2
1
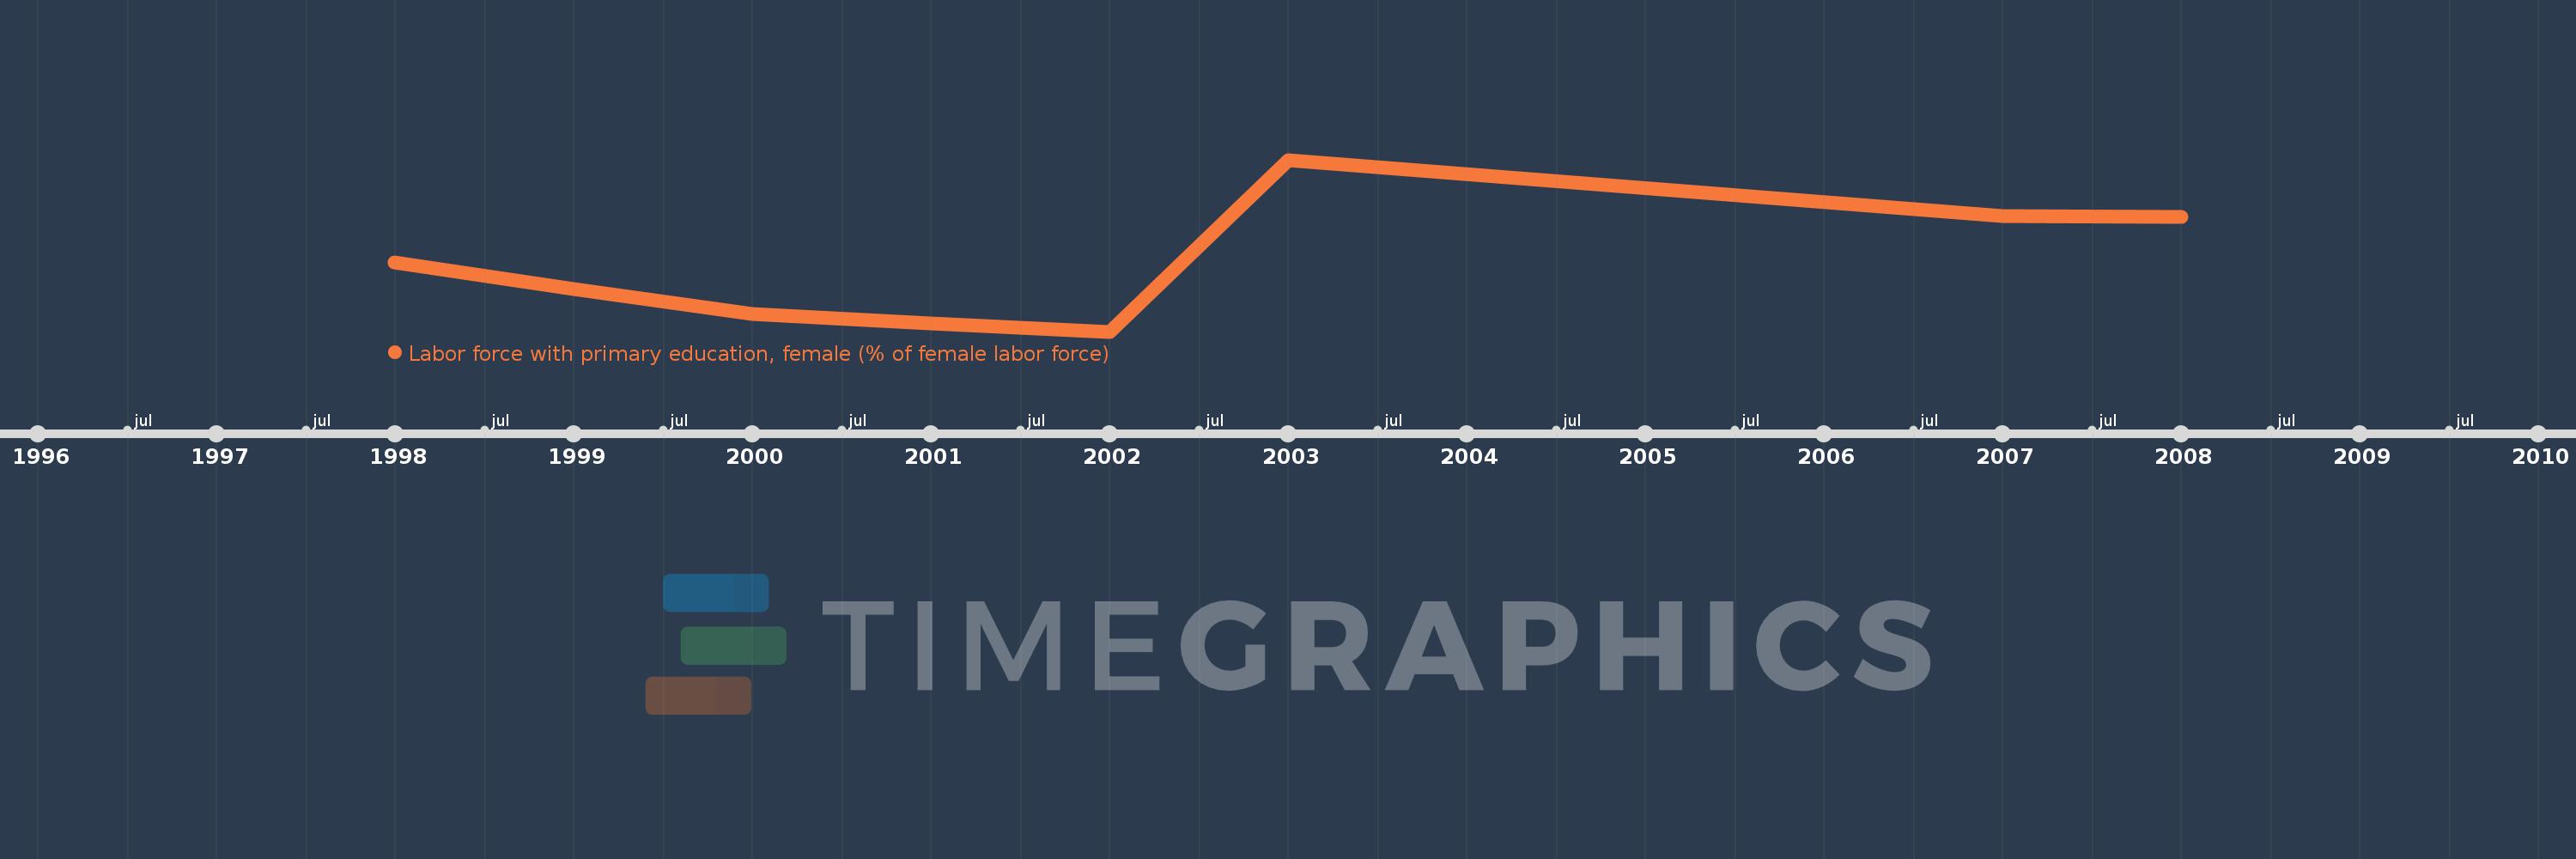
Labor force with primary education, female (% of female labor force)
2008,2007,2003,2002,2001,2000,1999,1998
This statistics in other country:
Timeline:
This timeline shows a graph from 1998 to 2008 of High income. No data until 1997. Number of actual observations by date: 8.
Source name:
World Development Indicators
Source organization:
International Labour Organization, Key Indicators of the Labour Market database.
Categories, topics:
Education, Social Protection & Labor, Gender
Last updated:
apr 23, 2017
Indicators value changes by year
Minimum:
19.991
jan 1, 2002
Maximum:
31.858
jan 1, 2003
At the date of observation
Value
Absolute change
Change from previous value
jan 1, 1998
24.758
+24.758
0.0%
jan 1, 1999
22.918
-1.84
-7.43%
jan 1, 2000
21.188
-1.73
-7.55%
jan 1, 2001
20.543
-0.644
-3.04%
jan 1, 2002
19.991
-0.552
-2.69%
jan 1, 2003
31.858
+11.866
59.36%
jan 1, 2007
27.971
-3.887
-12.2%
jan 1, 2008
27.883
-0.088
-0.32%
Ranking of countries by current statistics by years


Comments: