29
/
en
AIzaSyAYiBZKx7MnpbEhh9jyipgxe19OcubqV5w
April 1, 2024
52752
OECD members
OED
false
2
1
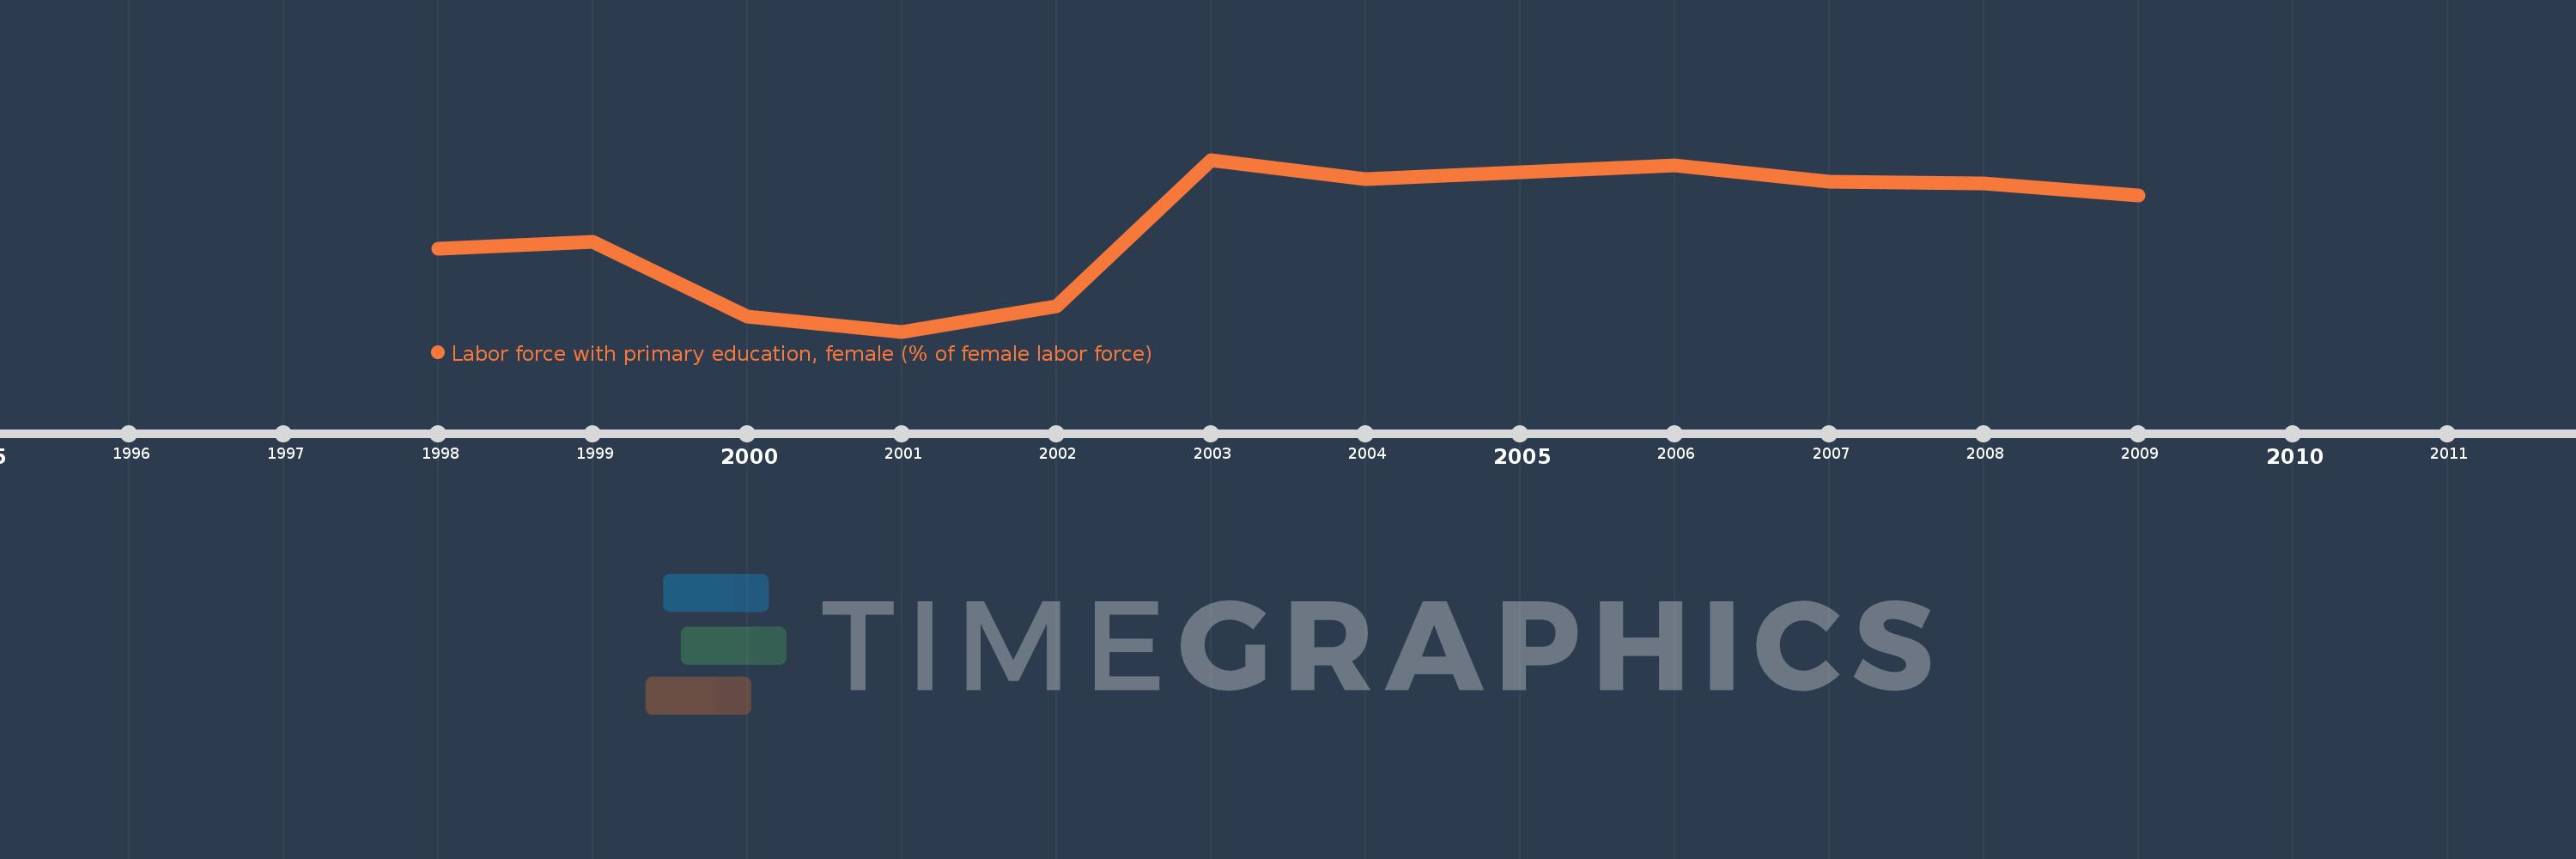
Labor force with primary education, female (% of female labor force)
2009,2008,2007,2006,2004,2003,2002,2001,2000,1999,1998
This statistics in other country:
Timeline:
This timeline shows a graph from 1998 to 2009 of OECD members. No data until 1997. Number of actual observations by date: 11.
Source name:
World Development Indicators
Source organization:
International Labour Organization, Key Indicators of the Labour Market database.
Categories, topics:
Education, Social Protection & Labor, Gender
Last updated:
apr 23, 2017
Indicators value changes by year
Maximum:
32.287
jan 1, 2003
At the date of observation
Value
Absolute change
Change from previous value
jan 1, 1998
26.806
+26.806
0.0%
jan 1, 1999
27.235
+0.428
1.6%
jan 1, 2000
22.666
-4.569
-16.77%
jan 1, 2001
21.74
-0.926
-4.08%
jan 1, 2002
23.274
+1.533
7.05%
jan 1, 2003
32.287
+9.014
38.73%
jan 1, 2004
31.084
-1.203
-3.73%
jan 1, 2006
31.94
+0.856
2.75%
jan 1, 2007
30.966
-0.974
-3.05%
jan 1, 2008
30.824
-0.142
-0.46%
jan 1, 2009
30.122
-0.702
-2.28%
Ranking of countries by current statistics by years


Comments: