29
/
en
AIzaSyAYiBZKx7MnpbEhh9jyipgxe19OcubqV5w
April 1, 2024
25838
Central Europe and the Baltics
CEB
false
2
1
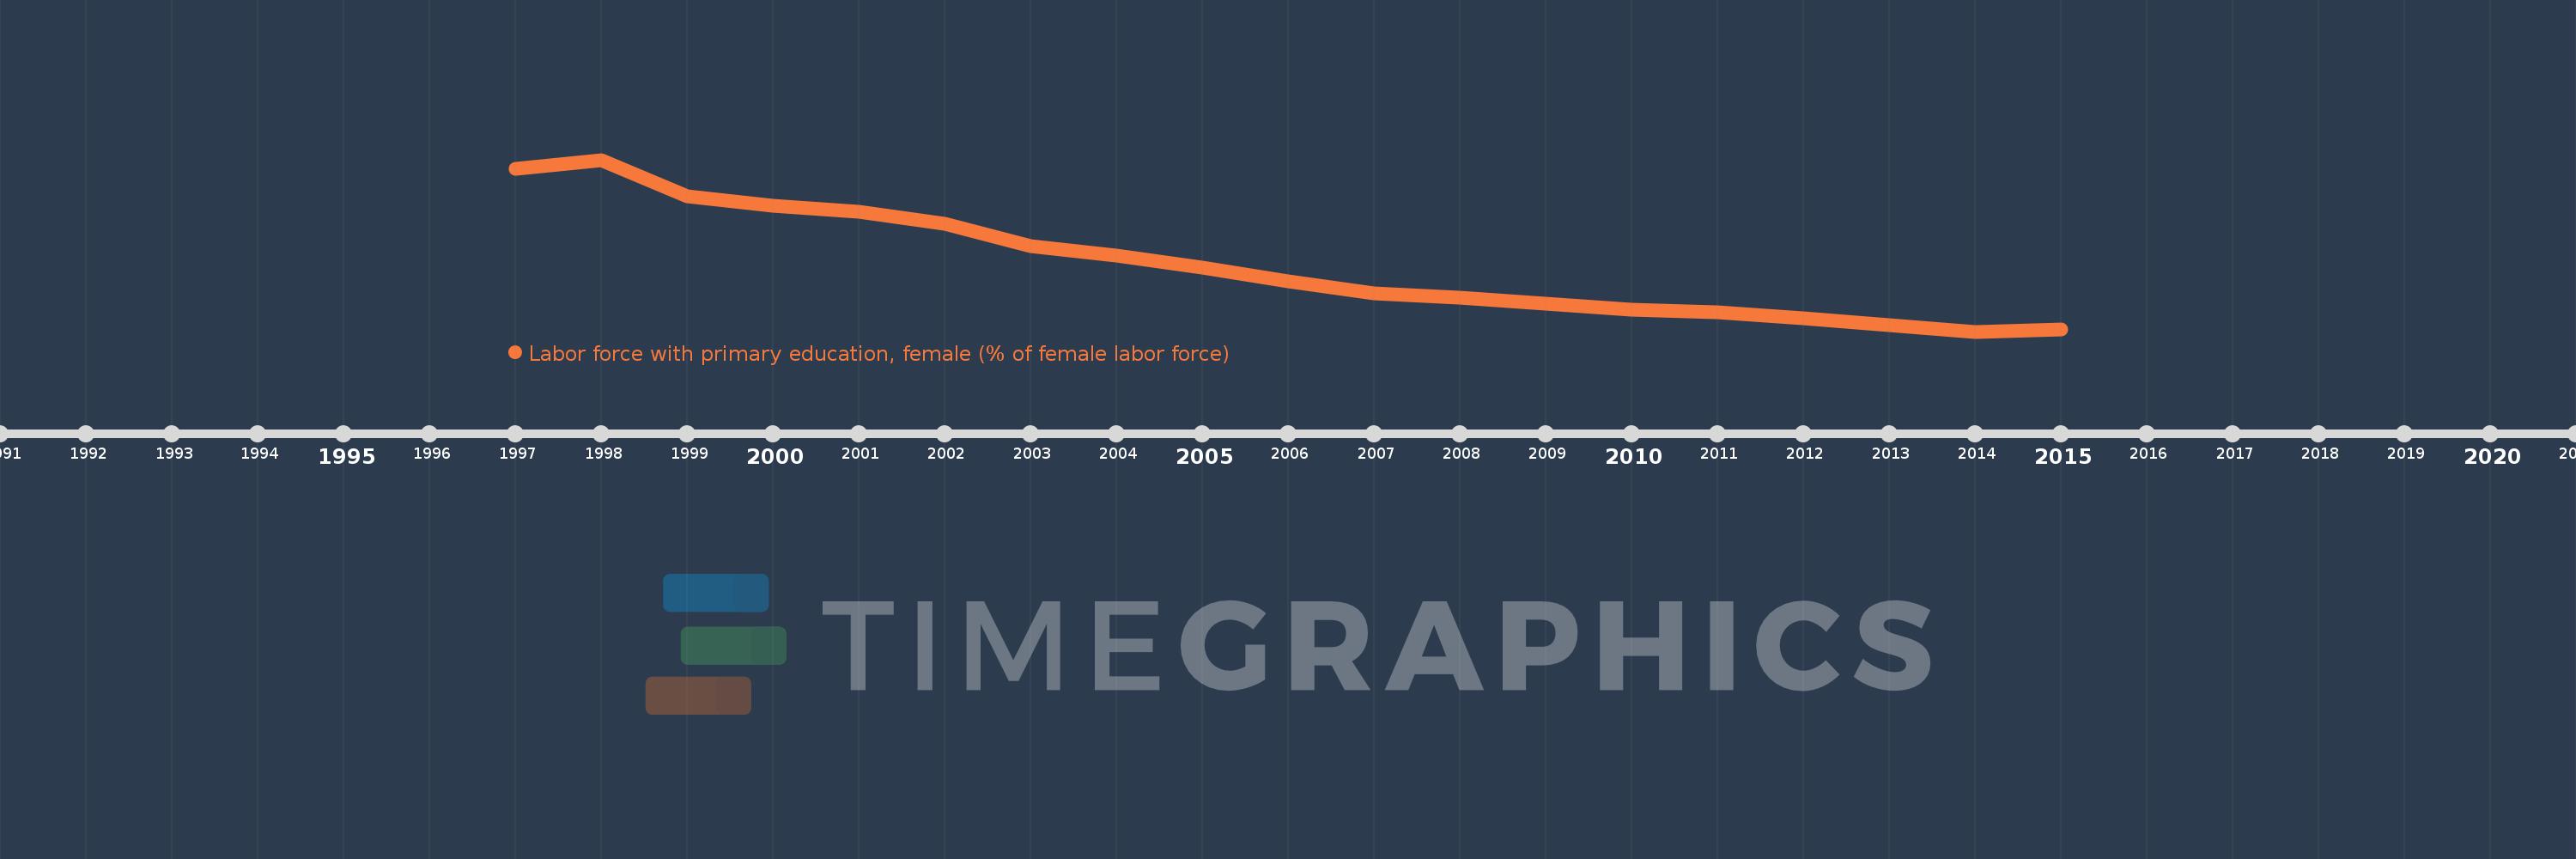
Labor force with primary education, female (% of female labor force)
2015,2014,2013,2012,2011,2010,2009,2008,2007,2006,2005,2004,2003,2002,2001,2000,1999,1998,1997
This statistics in other country:
Timeline:
This timeline shows a graph from 1997 to 2015 of Central Europe and the Baltics. No data until 1996. Number of actual observations by date: 19.
Source name:
World Development Indicators
Source organization:
International Labour Organization, Key Indicators of the Labour Market database.
Categories, topics:
Education, Social Protection & Labor, Gender
Last updated:
apr 23, 2017
Indicators value changes by year
Minimum:
10.617
jan 1, 2014
Maximum:
26.836
jan 1, 1998
At the date of observation
Value
Absolute change
Change from previous value
jan 1, 1997
25.98
+25.98
0.0%
jan 1, 1998
26.836
+0.856
3.3%
jan 1, 1999
23.419
-3.417
-12.73%
jan 1, 2000
22.457
-0.963
-4.11%
jan 1, 2001
21.901
-0.555
-2.47%
jan 1, 2002
20.76
-1.141
-5.21%
jan 1, 2003
18.707
-2.053
-9.89%
jan 1, 2004
17.793
-0.914
-4.89%
jan 1, 2005
16.626
-1.167
-6.56%
jan 1, 2006
15.348
-1.278
-7.69%
jan 1, 2007
14.245
-1.102
-7.18%
jan 1, 2008
13.791
-0.454
-3.19%
jan 1, 2009
13.269
-0.522
-3.78%
jan 1, 2010
12.725
-0.544
-4.1%
jan 1, 2011
12.451
-0.274
-2.16%
jan 1, 2012
11.857
-0.593
-4.77%
jan 1, 2013
11.253
-0.604
-5.1%
jan 1, 2014
10.617
-0.636
-5.65%
jan 1, 2015
10.845
+0.228
2.14%
Ranking of countries by current statistics by years


Comments: