29
/
en
AIzaSyAYiBZKx7MnpbEhh9jyipgxe19OcubqV5w
April 1, 2024
41604
Latin America & Caribbean
LCN
false
2
1
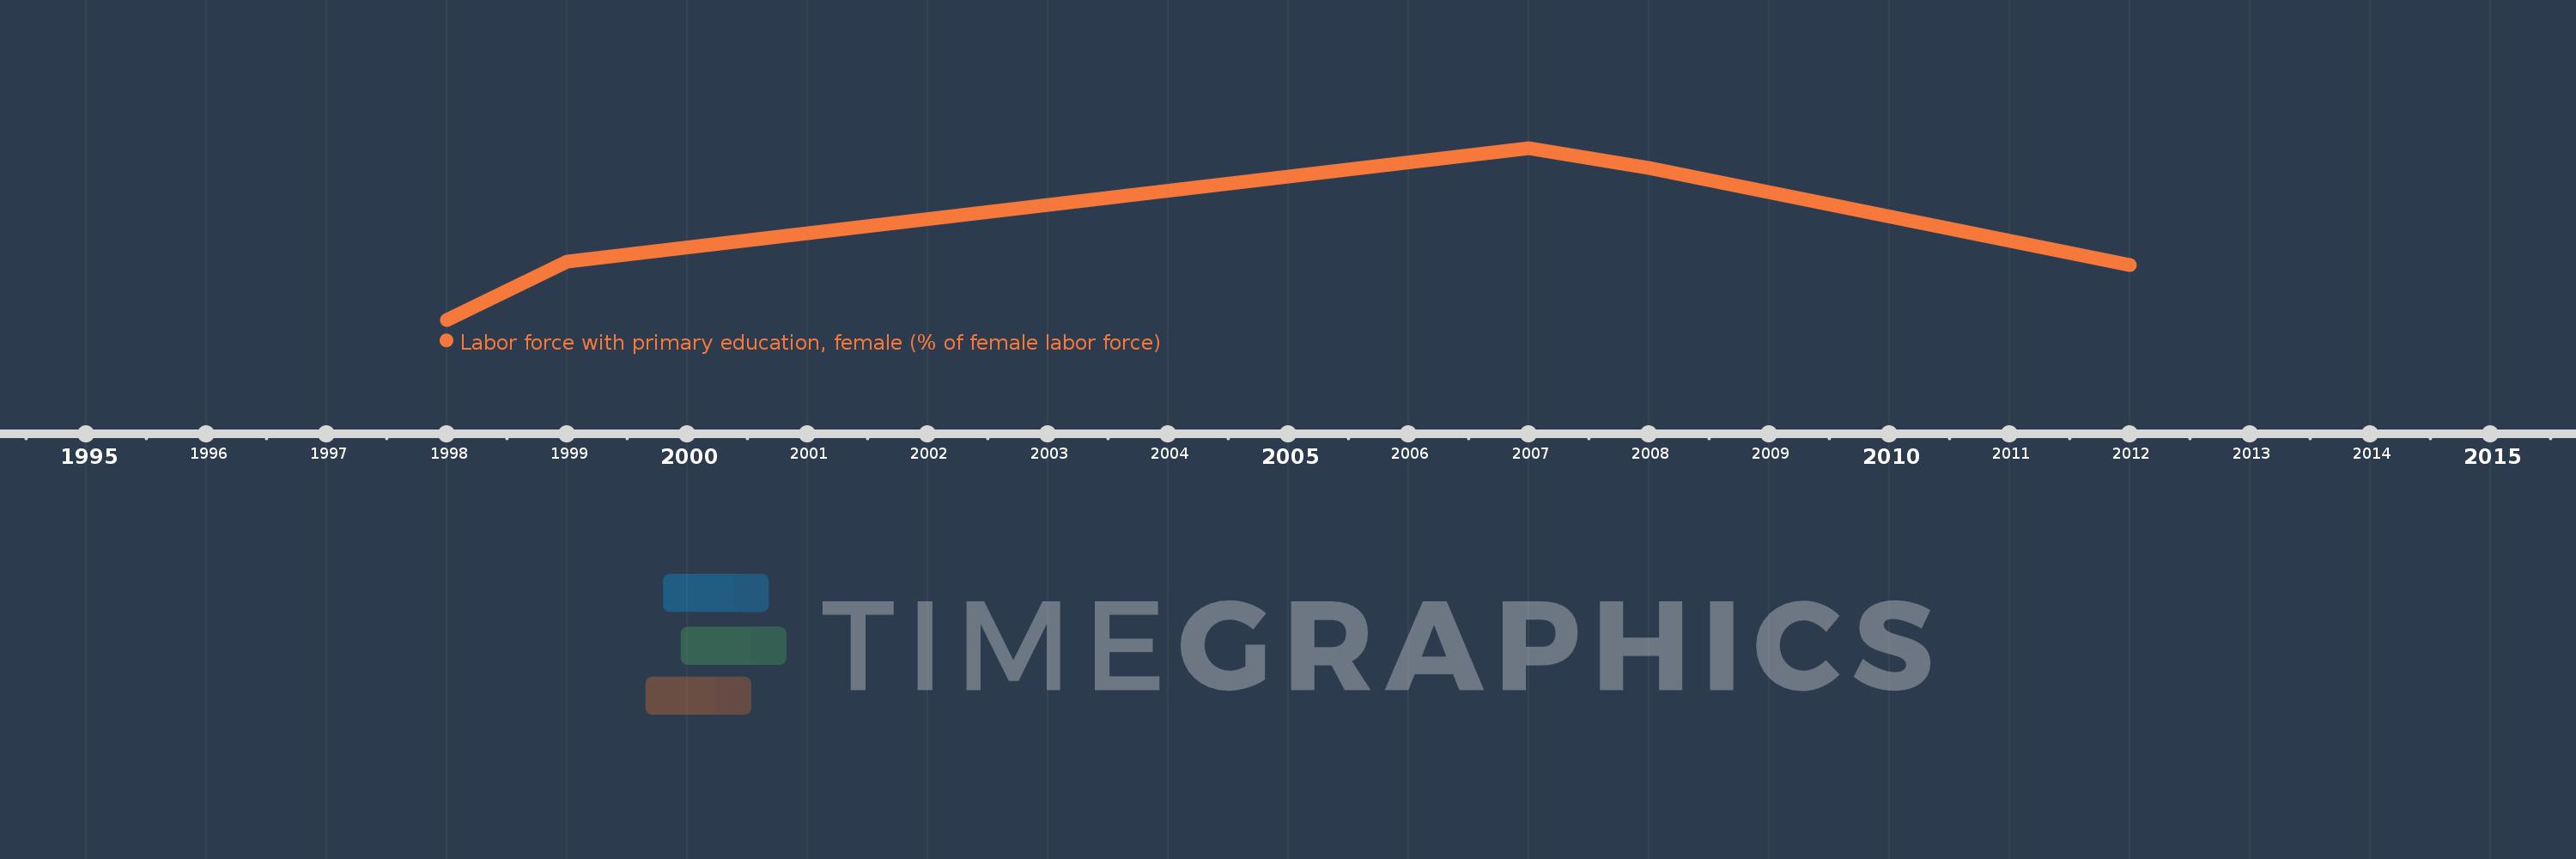
Labor force with primary education, female (% of female labor force)
2012,2008,2007,1999,1998
This statistics in other country:
Timeline:
This timeline shows a graph from 1998 to 2012 of Latin America & Caribbean . No data until 1997. Number of actual observations by date: 5.
Source name:
World Development Indicators
Source organization:
International Labour Organization, Key Indicators of the Labour Market database.
Categories, topics:
Education, Social Protection & Labor, Gender
Last updated:
apr 23, 2017
Indicators value changes by year
Minimum:
24.014
jan 1, 1998
Maximum:
39.945
jan 1, 2007
At the date of observation
Value
Absolute change
Change from previous value
jan 1, 1998
24.014
+24.014
0.0%
jan 1, 1999
29.397
+5.384
22.42%
jan 1, 2007
39.945
+10.548
35.88%
jan 1, 2008
38.08
-1.865
-4.67%
jan 1, 2012
29.057
-9.023
-23.7%
Ranking of countries by current statistics by years


Comments: