29
/
en
AIzaSyAYiBZKx7MnpbEhh9jyipgxe19OcubqV5w
April 1, 2024
31293
Europe & Central Asia (excluding high income)
ECA
false
2
1
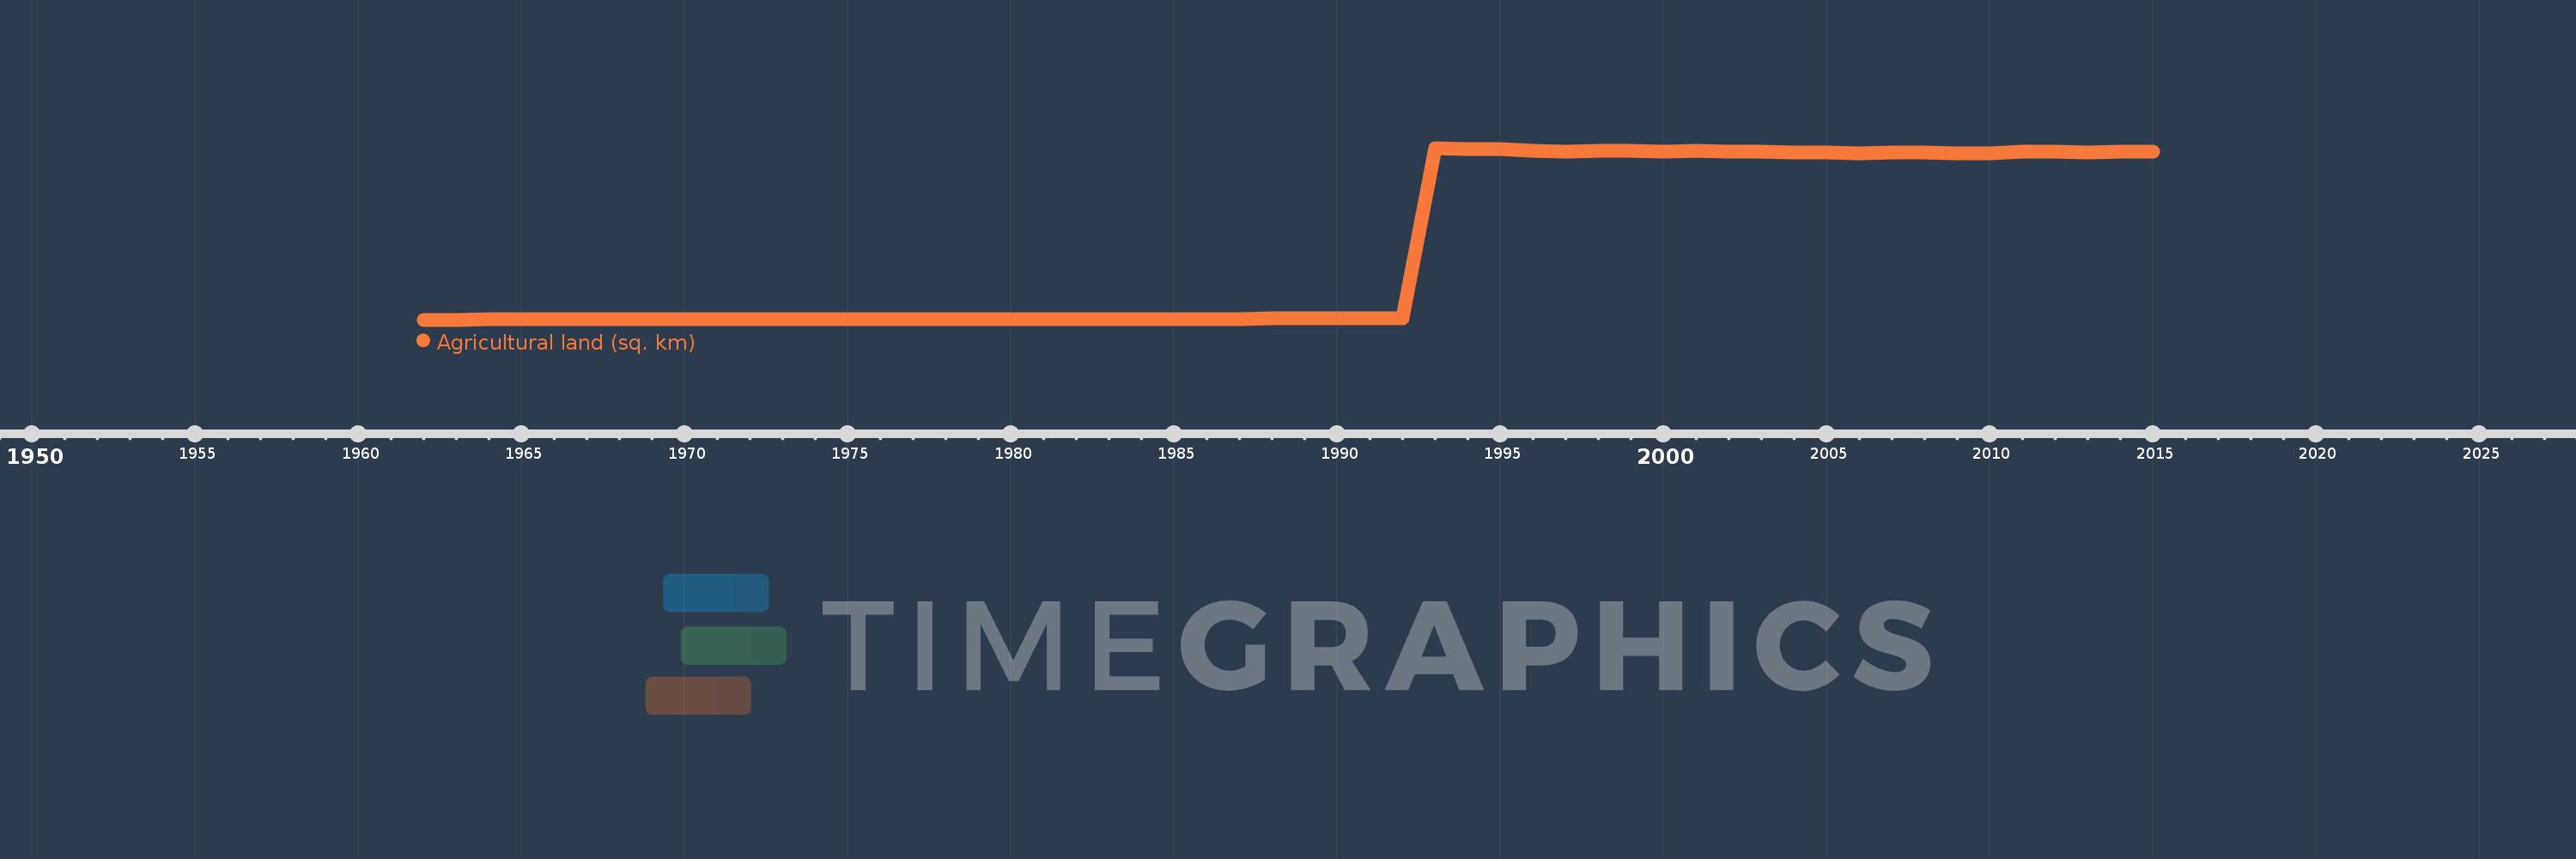
Agricultural land (sq. km)
2015,2014,2013,2012,2011,2010,2009,2008,2007,2006,2005,2004,2003,2002,2001,2000,1999,1998,1997,1996,1995,1994,1993,1992,1991,1990,1989,1988,1987,1986,1985,1984,1983,1982,1981,1980,1979,1978,1977,1976,1975,1974,1973,1972,1971,1970,1969,1968,1967,1966,1965,1964,1963,1962
This statistics in other country:
AfghanistanAlbaniaAlgeriaAmerican SamoaAndorraAngolaAntigua and BarbudaArab WorldArgentinaArmeniaArubaAustraliaAustriaAzerbaijanBahamas, TheBahrainBangladeshBarbadosBelarusBelgiumBelizeBeninBermudaBhutanBoliviaBosnia and HerzegovinaBotswanaBrazilBritish Virgin IslandsBrunei DarussalamBulgariaBurkina FasoBurundiCabo VerdeCambodiaCameroonCanadaCaribbean small statesCayman IslandsCentral African RepublicCentral Europe and the BalticsChadChannel IslandsChileChinaColombiaComorosCongo, Dem. Rep.Congo, Rep.Costa RicaCote d'IvoireCroatiaCubaCyprusCzech RepublicDenmarkDjiboutiDominicaDominican RepublicEarly-demographic dividendEast Asia & PacificEast Asia & Pacific (excluding high income)East Asia & Pacific (IDA & IBRD countries)EcuadorEgypt, Arab Rep.El SalvadorEquatorial GuineaEritreaEstoniaEthiopiaEuro areaEurope & Central AsiaEurope & Central Asia (excluding high income)Europe & Central Asia (IDA & IBRD countries)European UnionFaroe IslandsFijiFinlandFragile and conflict affected situationsFranceFrench PolynesiaGabonGambia, TheGeorgiaGermanyGhanaGreeceGreenlandGrenadaGuamGuatemalaGuineaGuinea-BissauGuyanaHaitiHeavily indebted poor countries (HIPC)High incomeHondurasHong Kong SAR, ChinaHungaryIBRD onlyIcelandIDA & IBRD totalIDA blendIDA onlyIDA totalIndiaIndonesiaIran, Islamic Rep.IraqIrelandIsle of ManIsraelItalyJamaicaJapanJordanKazakhstanKenyaKiribatiKorea, Dem. People’s Rep.Korea, Rep.KosovoKuwaitKyrgyz RepublicLao PDRLate-demographic dividendLatin America & Caribbean Latin America & Caribbean (excluding high income)Latin America & the Caribbean (IDA & IBRD countries)LatviaLeast developed countries: UN classificationLebanonLesothoLiberiaLibyaLiechtensteinLithuaniaLow & middle incomeLow incomeLower middle incomeLuxembourgMacedonia, FYRMadagascarMalawiMalaysiaMaldivesMaliMaltaMarshall IslandsMauritaniaMauritiusMexicoMicronesia, Fed. Sts.Middle East & North AfricaMiddle East & North Africa (excluding high income)Middle East & North Africa (IDA & IBRD countries)Middle incomeMoldovaMongoliaMontenegroMoroccoMozambiqueMyanmarNamibiaNauruNepalNetherlandsNew CaledoniaNew ZealandNicaraguaNigerNigeriaNorth AmericaNorthern Mariana IslandsNorwayOECD membersOmanOther small statesPacific island small statesPakistanPalauPanamaPapua New GuineaParaguayPeruPhilippinesPolandPortugalPost-demographic dividendPre-demographic dividendPuerto RicoQatarRomaniaRussian FederationRwandaSamoaSan MarinoSao Tome and PrincipeSaudi ArabiaSenegalSerbiaSeychellesSierra LeoneSingaporeSlovak RepublicSloveniaSmall statesSolomon IslandsSomaliaSouth AfricaSouth AsiaSouth Asia (IDA & IBRD)South SudanSpainSri LankaSt. Kitts and NevisSt. LuciaSt. Vincent and the GrenadinesSub-Saharan Africa Sub-Saharan Africa (excluding high income)Sub-Saharan Africa (IDA & IBRD countries)SudanSurinameSwazilandSwedenSwitzerlandSyrian Arab RepublicTajikistanTanzaniaThailandTimor-LesteTogoTongaTrinidad and TobagoTunisiaTurkeyTurkmenistanTurks and Caicos IslandsTuvaluUgandaUkraineUnited Arab EmiratesUnited KingdomUnited StatesUpper middle incomeUruguayUzbekistanVanuatuVenezuela, RBVietnamVirgin Islands (U.S.)West Bank and GazaWorldYemen, Rep.ZambiaZimbabwe Timeline:
This timeline shows a graph from 1962 to 2015 of Europe & Central Asia (excluding high income). No data until 1961. Number of actual observations by date: 54.
Source name:
World Development Indicators
Source organization:
Food and Agriculture Organization, electronic files and web site.
Categories, topics:
Agriculture & Rural Development, Climate Change
Last updated:
apr 23, 2017
Indicators value changes by year
Minimum:
580.23K
jan 1, 1962
Maximum:
6.49 mln
jan 1, 1993
At the date of observation
Value
Absolute change
Change from previous value
jan 1, 1962
580.23K
+580.23K
0.0%
jan 1, 1963
582.53K
+2.3K
0.4%
jan 1, 1964
590.2K
+7.67K
1.32%
jan 1, 1965
590.36K
+160.0
0.03%
jan 1, 1966
591.17K
+810.0
0.14%
jan 1, 1967
593.61K
+2.44K
0.41%
jan 1, 1968
592.45K
-1.16K
-0.2%
jan 1, 1969
596.94K
+4.49K
0.76%
jan 1, 1970
608.68K
+11.74K
1.97%
jan 1, 1971
603.48K
-5.2K
-0.85%
jan 1, 1972
604.58K
+1.1K
0.18%
jan 1, 1973
609.65K
+5.07K
0.84%
jan 1, 1974
608.19K
-1.46K
-0.24%
jan 1, 1975
604.17K
-4.02K
-0.66%
jan 1, 1976
599.43K
-4.74K
-0.78%
jan 1, 1977
601.31K
+1.88K
0.31%
jan 1, 1978
603.04K
+1.73K
0.29%
jan 1, 1979
603.35K
+310.0
0.05%
jan 1, 1980
611.82K
+8.47K
1.4%
jan 1, 1981
608.42K
-3.4K
-0.56%
jan 1, 1982
608.56K
+140.0
0.02%
jan 1, 1983
594.5K
-14.06K
-2.31%
jan 1, 1984
589.86K
-4.64K
-0.78%
jan 1, 1985
598.9K
+9.04K
1.53%
jan 1, 1986
604.31K
+5.41K
0.9%
jan 1, 1987
607.98K
+3.67K
0.61%
jan 1, 1988
617.97K
+9.99K
1.64%
jan 1, 1989
616.51K
-1.46K
-0.24%
jan 1, 1990
619.33K
+2.82K
0.46%
jan 1, 1991
617.26K
-2.07K
-0.33%
jan 1, 1992
621.53K
+4.27K
0.69%
jan 1, 1993
6.49 mln
+5.868 mln
944.12%
jan 1, 1994
6.463 mln
-26.426K
-0.41%
jan 1, 1995
6.456 mln
-7.566K
-0.12%
jan 1, 1996
6.393 mln
-62.284K
-0.96%
jan 1, 1997
6.375 mln
-18.738K
-0.29%
jan 1, 1998
6.395 mln
+20.927K
0.33%
jan 1, 1999
6.381 mln
-14.226K
-0.22%
jan 1, 2000
6.376 mln
-4.892K
-0.08%
jan 1, 2001
6.384 mln
+7.28K
0.11%
jan 1, 2002
6.374 mln
-9.345K
-0.15%
jan 1, 2003
6.359 mln
-15.314K
-0.24%
jan 1, 2004
6.342 mln
-17.148K
-0.27%
jan 1, 2005
6.328 mln
-14.102K
-0.22%
jan 1, 2006
6.318 mln
-10.002K
-0.16%
jan 1, 2007
6.343 mln
+25.344K
0.4%
jan 1, 2008
6.325 mln
-17.625K
-0.28%
jan 1, 2009
6.308 mln
-16.938K
-0.27%
jan 1, 2010
6.301 mln
-7.818K
-0.12%
jan 1, 2011
6.355 mln
+54.162K
0.86%
jan 1, 2012
6.348 mln
-6.329K
-0.1%
jan 1, 2013
6.346 mln
-2.256K
-0.04%
jan 1, 2014
6.369 mln
+22.341K
0.35%
jan 1, 2015
6.377 mln
+8.414K
0.13%
Ranking of countries by current statistics by years


Comments: