29
/
en
AIzaSyAYiBZKx7MnpbEhh9jyipgxe19OcubqV5w
April 1, 2024
50628
Middle income
MIC
false
2
1
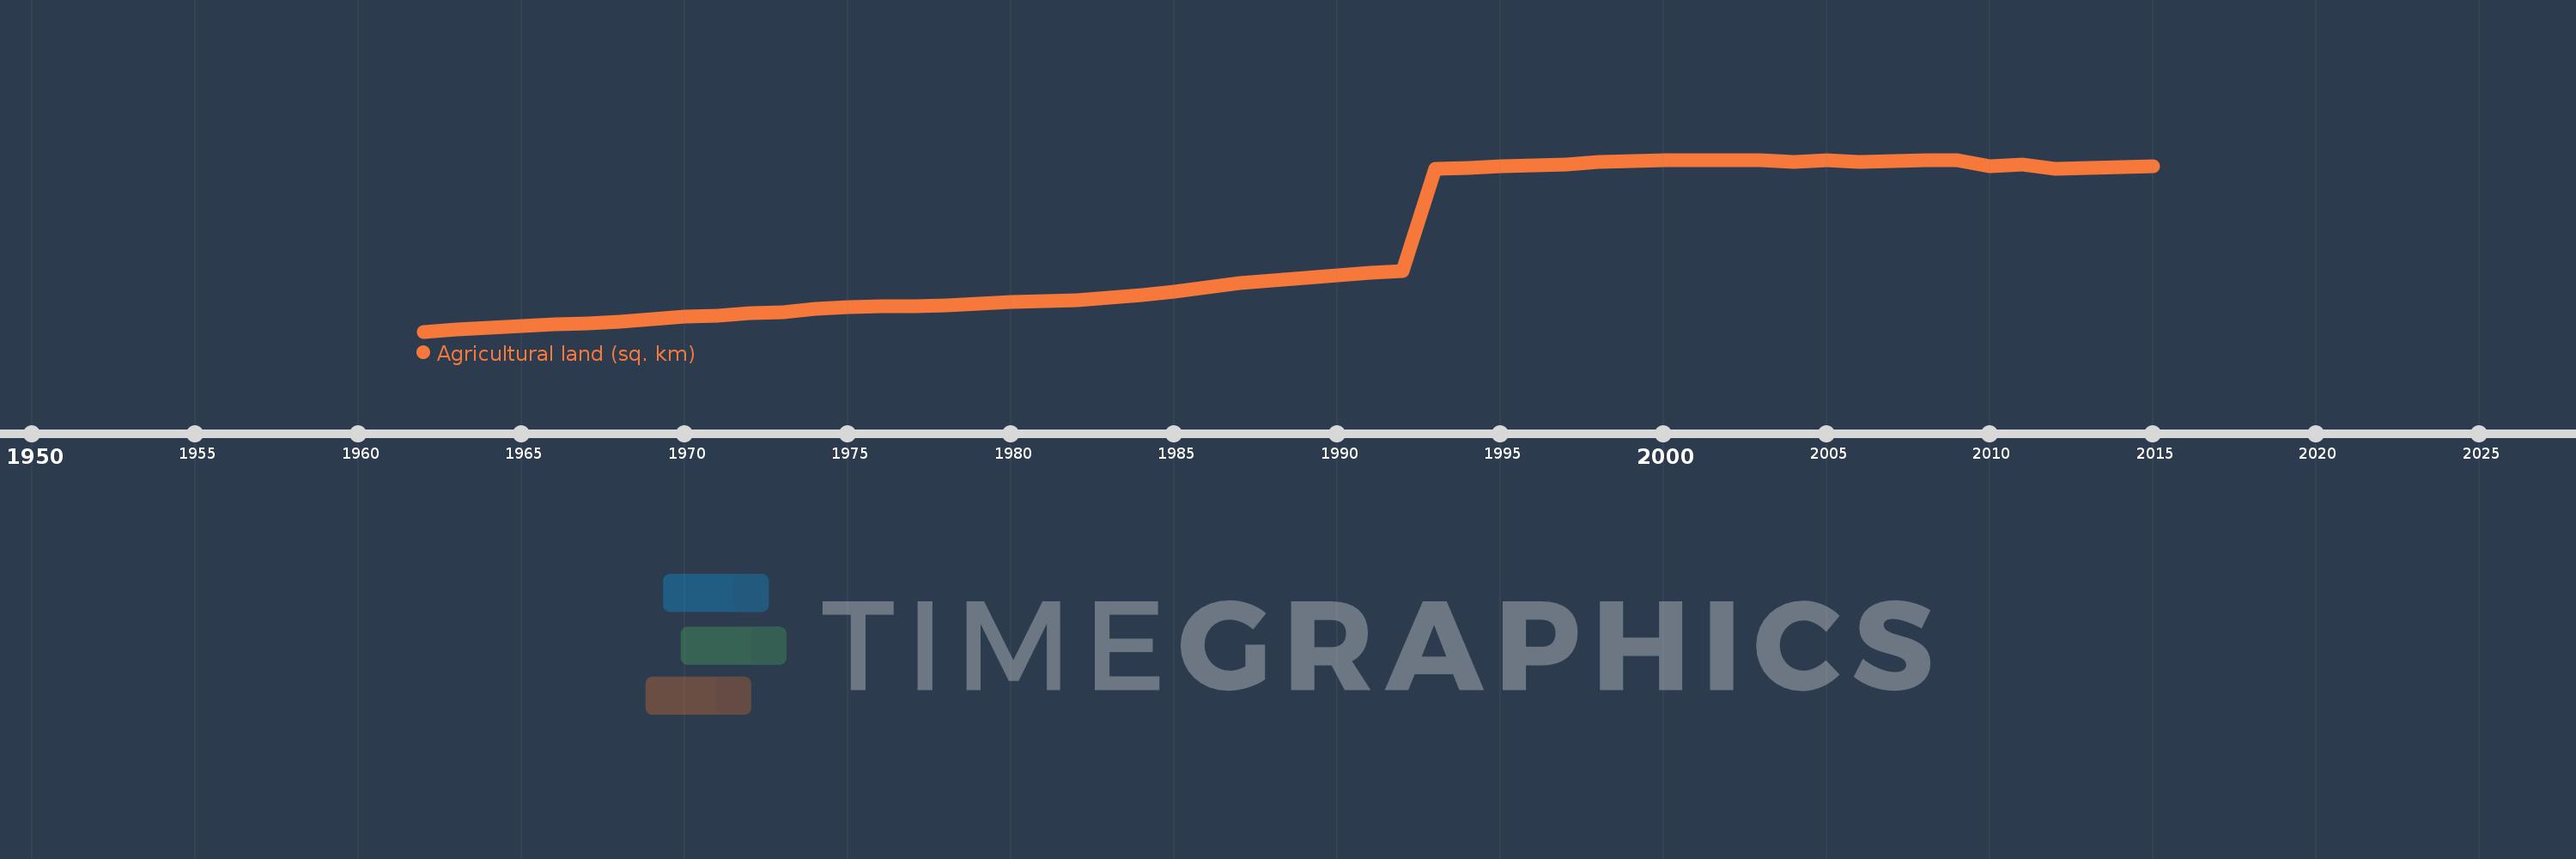
Agricultural land (sq. km)
2015,2014,2013,2012,2011,2010,2009,2008,2007,2006,2005,2004,2003,2002,2001,2000,1999,1998,1997,1996,1995,1994,1993,1992,1991,1990,1989,1988,1987,1986,1985,1984,1983,1982,1981,1980,1979,1978,1977,1976,1975,1974,1973,1972,1971,1970,1969,1968,1967,1966,1965,1964,1963,1962
This statistics in other country:
AfghanistanAlbaniaAlgeriaAmerican SamoaAndorraAngolaAntigua and BarbudaArab WorldArgentinaArmeniaArubaAustraliaAustriaAzerbaijanBahamas, TheBahrainBangladeshBarbadosBelarusBelgiumBelizeBeninBermudaBhutanBoliviaBosnia and HerzegovinaBotswanaBrazilBritish Virgin IslandsBrunei DarussalamBulgariaBurkina FasoBurundiCabo VerdeCambodiaCameroonCanadaCaribbean small statesCayman IslandsCentral African RepublicCentral Europe and the BalticsChadChannel IslandsChileChinaColombiaComorosCongo, Dem. Rep.Congo, Rep.Costa RicaCote d'IvoireCroatiaCubaCyprusCzech RepublicDenmarkDjiboutiDominicaDominican RepublicEarly-demographic dividendEast Asia & PacificEast Asia & Pacific (excluding high income)East Asia & Pacific (IDA & IBRD countries)EcuadorEgypt, Arab Rep.El SalvadorEquatorial GuineaEritreaEstoniaEthiopiaEuro areaEurope & Central AsiaEurope & Central Asia (excluding high income)Europe & Central Asia (IDA & IBRD countries)European UnionFaroe IslandsFijiFinlandFragile and conflict affected situationsFranceFrench PolynesiaGabonGambia, TheGeorgiaGermanyGhanaGreeceGreenlandGrenadaGuamGuatemalaGuineaGuinea-BissauGuyanaHaitiHeavily indebted poor countries (HIPC)High incomeHondurasHong Kong SAR, ChinaHungaryIBRD onlyIcelandIDA & IBRD totalIDA blendIDA onlyIDA totalIndiaIndonesiaIran, Islamic Rep.IraqIrelandIsle of ManIsraelItalyJamaicaJapanJordanKazakhstanKenyaKiribatiKorea, Dem. People’s Rep.Korea, Rep.KosovoKuwaitKyrgyz RepublicLao PDRLate-demographic dividendLatin America & Caribbean Latin America & Caribbean (excluding high income)Latin America & the Caribbean (IDA & IBRD countries)LatviaLeast developed countries: UN classificationLebanonLesothoLiberiaLibyaLiechtensteinLithuaniaLow & middle incomeLow incomeLower middle incomeLuxembourgMacedonia, FYRMadagascarMalawiMalaysiaMaldivesMaliMaltaMarshall IslandsMauritaniaMauritiusMexicoMicronesia, Fed. Sts.Middle East & North AfricaMiddle East & North Africa (excluding high income)Middle East & North Africa (IDA & IBRD countries)Middle incomeMoldovaMongoliaMontenegroMoroccoMozambiqueMyanmarNamibiaNauruNepalNetherlandsNew CaledoniaNew ZealandNicaraguaNigerNigeriaNorth AmericaNorthern Mariana IslandsNorwayOECD membersOmanOther small statesPacific island small statesPakistanPalauPanamaPapua New GuineaParaguayPeruPhilippinesPolandPortugalPost-demographic dividendPre-demographic dividendPuerto RicoQatarRomaniaRussian FederationRwandaSamoaSan MarinoSao Tome and PrincipeSaudi ArabiaSenegalSerbiaSeychellesSierra LeoneSingaporeSlovak RepublicSloveniaSmall statesSolomon IslandsSomaliaSouth AfricaSouth AsiaSouth Asia (IDA & IBRD)South SudanSpainSri LankaSt. Kitts and NevisSt. LuciaSt. Vincent and the GrenadinesSub-Saharan Africa Sub-Saharan Africa (excluding high income)Sub-Saharan Africa (IDA & IBRD countries)SudanSurinameSwazilandSwedenSwitzerlandSyrian Arab RepublicTajikistanTanzaniaThailandTimor-LesteTogoTongaTrinidad and TobagoTunisiaTurkeyTurkmenistanTurks and Caicos IslandsTuvaluUgandaUkraineUnited Arab EmiratesUnited KingdomUnited StatesUpper middle incomeUruguayUzbekistanVanuatuVenezuela, RBVietnamVirgin Islands (U.S.)West Bank and GazaWorldYemen, Rep.ZambiaZimbabwe Timeline:
This timeline shows a graph from 1962 to 2015 of Middle income. No data until 1961. Number of actual observations by date: 54.
Source name:
World Development Indicators
Source organization:
Food and Agriculture Organization, electronic files and web site.
Categories, topics:
Agriculture & Rural Development, Climate Change
Last updated:
apr 23, 2017
Indicators value changes by year
Minimum:
21.018 mln
jan 1, 1962
Maximum:
31.016 mln
jan 1, 2001
At the date of observation
Value
Absolute change
Change from previous value
jan 1, 1962
21.018 mln
+21.018 mln
0.0%
jan 1, 1963
21.123 mln
+104.268K
0.5%
jan 1, 1964
21.233 mln
+110.023K
0.52%
jan 1, 1965
21.328 mln
+95.73K
0.45%
jan 1, 1966
21.442 mln
+113.905K
0.53%
jan 1, 1967
21.508 mln
+65.326K
0.3%
jan 1, 1968
21.612 mln
+104.543K
0.49%
jan 1, 1969
21.719 mln
+106.542K
0.49%
jan 1, 1970
21.913 mln
+194.473K
0.9%
jan 1, 1971
21.965 mln
+52.275K
0.24%
jan 1, 1972
22.079 mln
+113.179K
0.52%
jan 1, 1973
22.166 mln
+87.449K
0.4%
jan 1, 1974
22.341 mln
+175.095K
0.79%
jan 1, 1975
22.427 mln
+85.957K
0.38%
jan 1, 1976
22.515 mln
+87.5K
0.39%
jan 1, 1977
22.474 mln
-40.38K
-0.18%
jan 1, 1978
22.553 mln
+78.87K
0.35%
jan 1, 1979
22.638 mln
+84.666K
0.38%
jan 1, 1980
22.722 mln
+84.74K
0.37%
jan 1, 1981
22.816 mln
+93.752K
0.41%
jan 1, 1982
22.828 mln
+12.202K
0.05%
jan 1, 1983
23.008 mln
+179.313K
0.79%
jan 1, 1984
23.147 mln
+138.985K
0.6%
jan 1, 1985
23.367 mln
+220.069K
0.95%
jan 1, 1986
23.607 mln
+240.464K
1.03%
jan 1, 1987
23.82 mln
+212.662K
0.9%
jan 1, 1988
24.008 mln
+188.289K
0.79%
jan 1, 1989
24.144 mln
+135.382K
0.56%
jan 1, 1990
24.292 mln
+148.461K
0.61%
jan 1, 1991
24.422 mln
+130.108K
0.54%
jan 1, 1992
24.56 mln
+137.619K
0.56%
jan 1, 1993
30.488 mln
+5.928 mln
24.14%
jan 1, 1994
30.558 mln
+70.253K
0.23%
jan 1, 1995
30.64 mln
+81.277K
0.27%
jan 1, 1996
30.709 mln
+69.729K
0.23%
jan 1, 1997
30.749 mln
+39.282K
0.13%
jan 1, 1998
30.909 mln
+159.962K
0.52%
jan 1, 1999
30.948 mln
+39.405K
0.13%
jan 1, 2000
31.003 mln
+54.666K
0.18%
jan 1, 2001
31.016 mln
+13.558K
0.04%
jan 1, 2002
30.978 mln
-38.414K
-0.12%
jan 1, 2003
30.991 mln
+13.394K
0.04%
jan 1, 2004
30.91 mln
-80.921K
-0.26%
jan 1, 2005
31.014 mln
+103.205K
0.33%
jan 1, 2006
30.902 mln
-111.959K
-0.36%
jan 1, 2007
30.95 mln
+48.914K
0.16%
jan 1, 2008
31.003 mln
+52.654K
0.17%
jan 1, 2009
31.003 mln
-390.0
0.0%
jan 1, 2010
30.651 mln
-352.022K
-1.14%
jan 1, 2011
30.74 mln
+89.066K
0.29%
jan 1, 2012
30.475 mln
-265.041K
-0.86%
jan 1, 2013
30.529 mln
+53.963K
0.18%
jan 1, 2014
30.613 mln
+84.577K
0.28%
jan 1, 2015
30.639 mln
+25.475K
0.08%
Ranking of countries by current statistics by years


Comments: