29
/
en
AIzaSyAYiBZKx7MnpbEhh9jyipgxe19OcubqV5w
April 1, 2024
212584
Nigeria
NGA
true
2
1
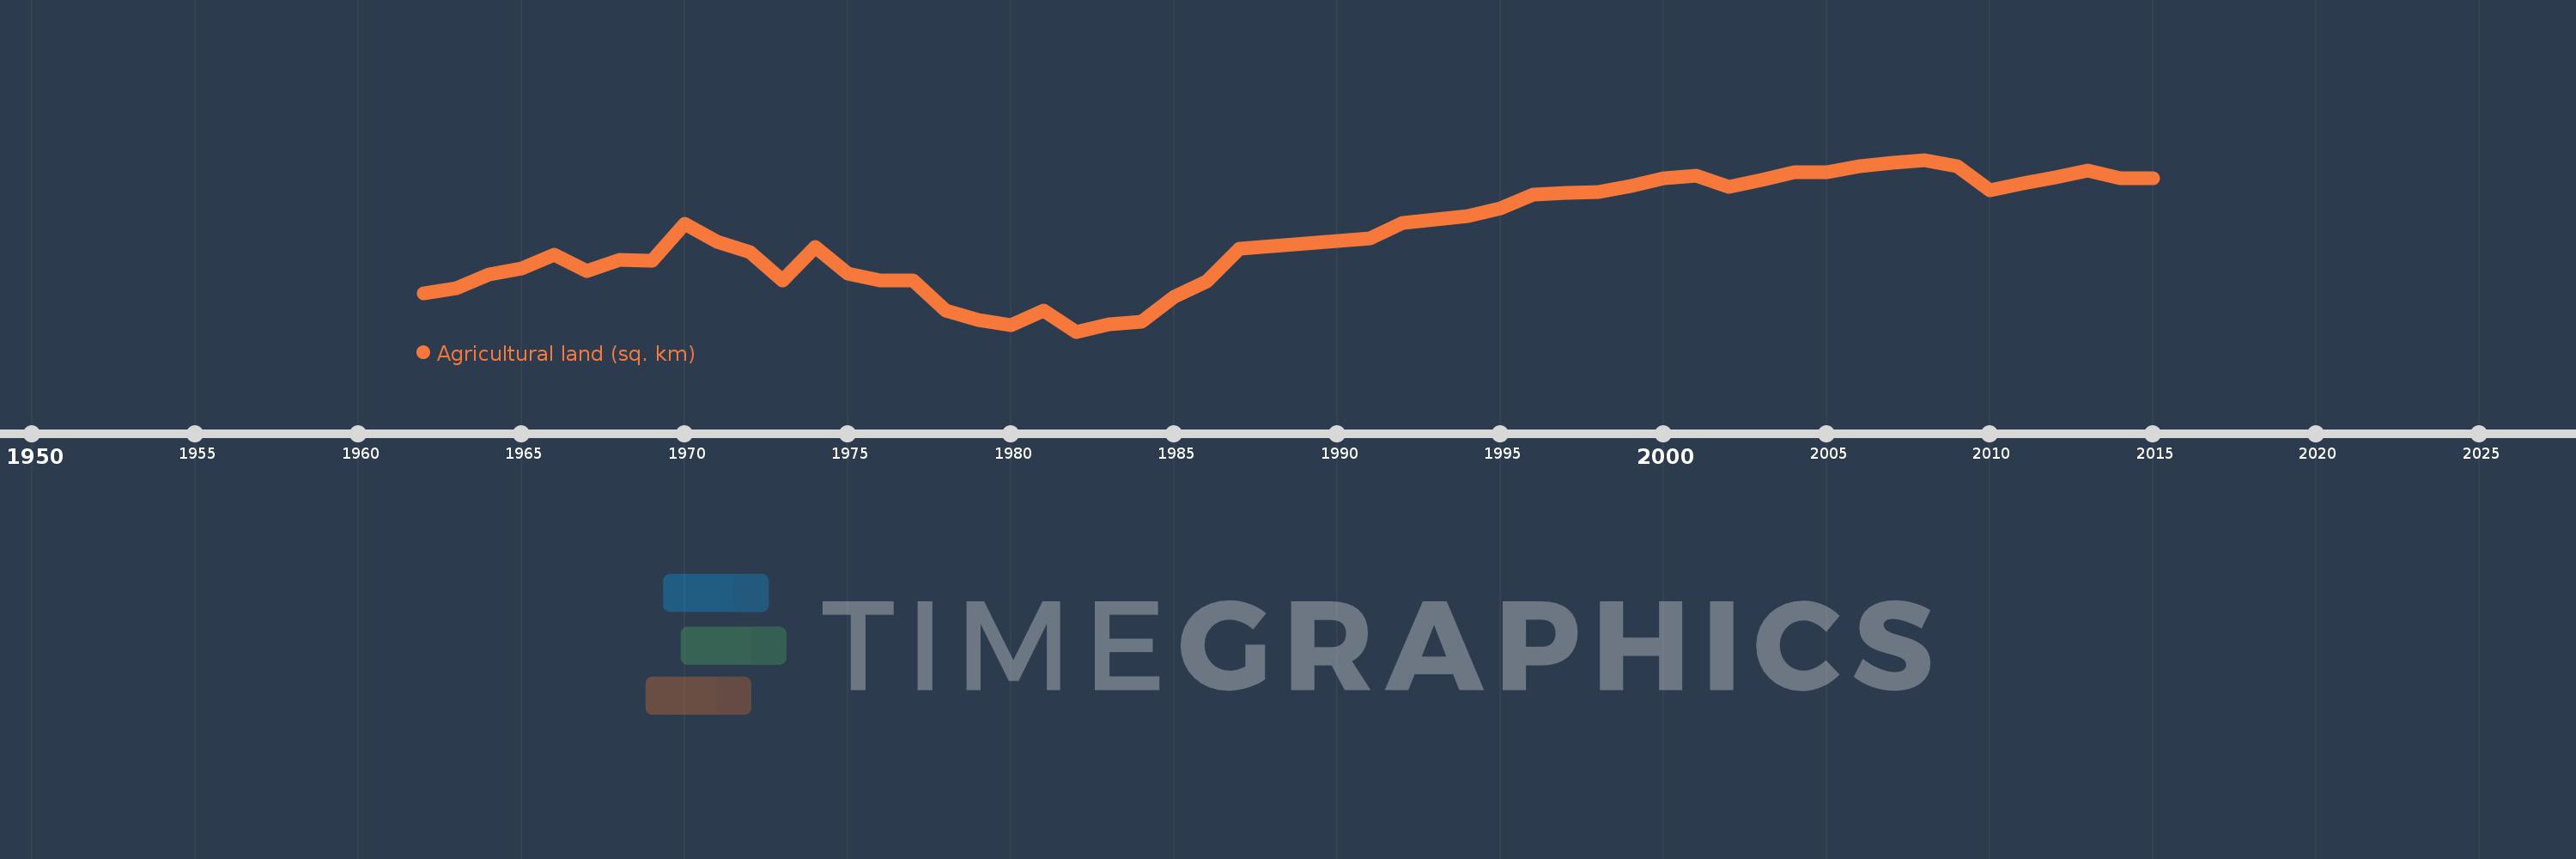
Agricultural land (sq. km)
2015,2014,2013,2012,2011,2010,2009,2008,2007,2006,2005,2004,2003,2002,2001,2000,1999,1998,1997,1996,1995,1994,1993,1992,1991,1990,1989,1988,1987,1986,1985,1984,1983,1982,1981,1980,1979,1978,1977,1976,1975,1974,1973,1972,1971,1970,1969,1968,1967,1966,1965,1964,1963,1962
This statistics in other country:
AfghanistanAlbaniaAlgeriaAmerican SamoaAndorraAngolaAntigua and BarbudaArab WorldArgentinaArmeniaArubaAustraliaAustriaAzerbaijanBahamas, TheBahrainBangladeshBarbadosBelarusBelgiumBelizeBeninBermudaBhutanBoliviaBosnia and HerzegovinaBotswanaBrazilBritish Virgin IslandsBrunei DarussalamBulgariaBurkina FasoBurundiCabo VerdeCambodiaCameroonCanadaCaribbean small statesCayman IslandsCentral African RepublicCentral Europe and the BalticsChadChannel IslandsChileChinaColombiaComorosCongo, Dem. Rep.Congo, Rep.Costa RicaCote d'IvoireCroatiaCubaCyprusCzech RepublicDenmarkDjiboutiDominicaDominican RepublicEarly-demographic dividendEast Asia & PacificEast Asia & Pacific (excluding high income)East Asia & Pacific (IDA & IBRD countries)EcuadorEgypt, Arab Rep.El SalvadorEquatorial GuineaEritreaEstoniaEthiopiaEuro areaEurope & Central AsiaEurope & Central Asia (excluding high income)Europe & Central Asia (IDA & IBRD countries)European UnionFaroe IslandsFijiFinlandFragile and conflict affected situationsFranceFrench PolynesiaGabonGambia, TheGeorgiaGermanyGhanaGreeceGreenlandGrenadaGuamGuatemalaGuineaGuinea-BissauGuyanaHaitiHeavily indebted poor countries (HIPC)High incomeHondurasHong Kong SAR, ChinaHungaryIBRD onlyIcelandIDA & IBRD totalIDA blendIDA onlyIDA totalIndiaIndonesiaIran, Islamic Rep.IraqIrelandIsle of ManIsraelItalyJamaicaJapanJordanKazakhstanKenyaKiribatiKorea, Dem. People’s Rep.Korea, Rep.KosovoKuwaitKyrgyz RepublicLao PDRLate-demographic dividendLatin America & Caribbean Latin America & Caribbean (excluding high income)Latin America & the Caribbean (IDA & IBRD countries)LatviaLeast developed countries: UN classificationLebanonLesothoLiberiaLibyaLiechtensteinLithuaniaLow & middle incomeLow incomeLower middle incomeLuxembourgMacedonia, FYRMadagascarMalawiMalaysiaMaldivesMaliMaltaMarshall IslandsMauritaniaMauritiusMexicoMicronesia, Fed. Sts.Middle East & North AfricaMiddle East & North Africa (excluding high income)Middle East & North Africa (IDA & IBRD countries)Middle incomeMoldovaMongoliaMontenegroMoroccoMozambiqueMyanmarNamibiaNauruNepalNetherlandsNew CaledoniaNew ZealandNicaraguaNigerNigeriaNorth AmericaNorthern Mariana IslandsNorwayOECD membersOmanOther small statesPacific island small statesPakistanPalauPanamaPapua New GuineaParaguayPeruPhilippinesPolandPortugalPost-demographic dividendPre-demographic dividendPuerto RicoQatarRomaniaRussian FederationRwandaSamoaSan MarinoSao Tome and PrincipeSaudi ArabiaSenegalSerbiaSeychellesSierra LeoneSingaporeSlovak RepublicSloveniaSmall statesSolomon IslandsSomaliaSouth AfricaSouth AsiaSouth Asia (IDA & IBRD)South SudanSpainSri LankaSt. Kitts and NevisSt. LuciaSt. Vincent and the GrenadinesSub-Saharan Africa Sub-Saharan Africa (excluding high income)Sub-Saharan Africa (IDA & IBRD countries)SudanSurinameSwazilandSwedenSwitzerlandSyrian Arab RepublicTajikistanTanzaniaThailandTimor-LesteTogoTongaTrinidad and TobagoTunisiaTurkeyTurkmenistanTurks and Caicos IslandsTuvaluUgandaUkraineUnited Arab EmiratesUnited KingdomUnited StatesUpper middle incomeUruguayUzbekistanVanuatuVenezuela, RBVietnamVirgin Islands (U.S.)West Bank and GazaWorldYemen, Rep.ZambiaZimbabwe Timeline:
This timeline shows a graph from 1962 to 2015 of Nigeria. No data until 1961. Number of actual observations by date: 54.
Source name:
World Development Indicators
Source organization:
Food and Agriculture Organization, electronic files and web site.
Categories, topics:
Agriculture & Rural Development, Climate Change
Last updated:
apr 23, 2017
Indicators value changes by year
Minimum:
472.19K
jan 1, 1982
Maximum:
737.0K
jan 1, 2008
At the date of observation
Value
Absolute change
Change from previous value
jan 1, 1962
531.765K
+531.765K
0.0%
jan 1, 1963
539.0K
+7.235K
1.36%
jan 1, 1964
560.169K
+21.169K
3.93%
jan 1, 1965
569.711K
+9.542K
1.7%
jan 1, 1966
590.701K
+20.991K
3.68%
jan 1, 1967
565.06K
-25.641K
-4.34%
jan 1, 1968
582.129K
+17.069K
3.02%
jan 1, 1969
581.72K
-409.2
-0.07%
jan 1, 1970
638.14K
+56.421K
9.7%
jan 1, 1971
610.305K
-27.836K
-4.36%
jan 1, 1972
594.776K
-15.529K
-2.54%
jan 1, 1973
551.5K
-43.276K
-7.28%
jan 1, 1974
603.0K
+51.5K
9.34%
jan 1, 1975
561.5K
-41.5K
-6.88%
jan 1, 1976
551.5K
-10.0K
-1.78%
jan 1, 1977
551.5K
0.0
0.0%
jan 1, 1978
504.93K
-46.57K
-8.44%
jan 1, 1979
489.55K
-15.38K
-3.05%
jan 1, 1980
482.34K
-7.21K
-1.47%
jan 1, 1981
504.38K
+22.04K
4.57%
jan 1, 1982
472.19K
-32.19K
-6.38%
jan 1, 1983
484.03K
+11.84K
2.51%
jan 1, 1984
486.93K
+2.9K
0.6%
jan 1, 1985
526.06K
+39.13K
8.04%
jan 1, 1986
549.24K
+23.18K
4.41%
jan 1, 1987
600.01K
+50.77K
9.24%
jan 1, 1988
603.41K
+3.4K
0.57%
jan 1, 1989
607.88K
+4.47K
0.74%
jan 1, 1990
611.82K
+3.94K
0.65%
jan 1, 1991
615.86K
+4.04K
0.66%
jan 1, 1992
639.29K
+23.43K
3.8%
jan 1, 1993
644.47K
+5.18K
0.81%
jan 1, 1994
650.65K
+6.18K
0.96%
jan 1, 1995
662.16K
+11.51K
1.77%
jan 1, 1996
684.0K
+21.84K
3.3%
jan 1, 1997
686.0K
+2.0K
0.29%
jan 1, 1998
688.0K
+2.0K
0.29%
jan 1, 1999
696.5K
+8.5K
1.24%
jan 1, 2000
709.0K
+12.5K
1.79%
jan 1, 2001
713.0K
+4.0K
0.56%
jan 1, 2002
695.0K
-18.0K
-2.52%
jan 1, 2003
706.0K
+11.0K
1.58%
jan 1, 2004
717.5K
+11.5K
1.63%
jan 1, 2005
718.0K
+500.0
0.07%
jan 1, 2006
727.0K
+9.0K
1.25%
jan 1, 2007
733.0K
+6.0K
0.83%
jan 1, 2008
737.0K
+4.0K
0.55%
jan 1, 2009
727.0K
-10.0K
-1.36%
jan 1, 2010
690.0K
-37.0K
-5.09%
jan 1, 2011
700.0K
+10.0K
1.45%
jan 1, 2012
710.0K
+10.0K
1.43%
jan 1, 2013
720.0K
+10.0K
1.41%
jan 1, 2014
708.0K
-12.0K
-1.67%
jan 1, 2015
708.0K
0.0
0.0%
Ranking of countries by current statistics by years


Comments: