29
/
en
AIzaSyAYiBZKx7MnpbEhh9jyipgxe19OcubqV5w
April 1, 2024
45836
Low income
LIC
false
2
1
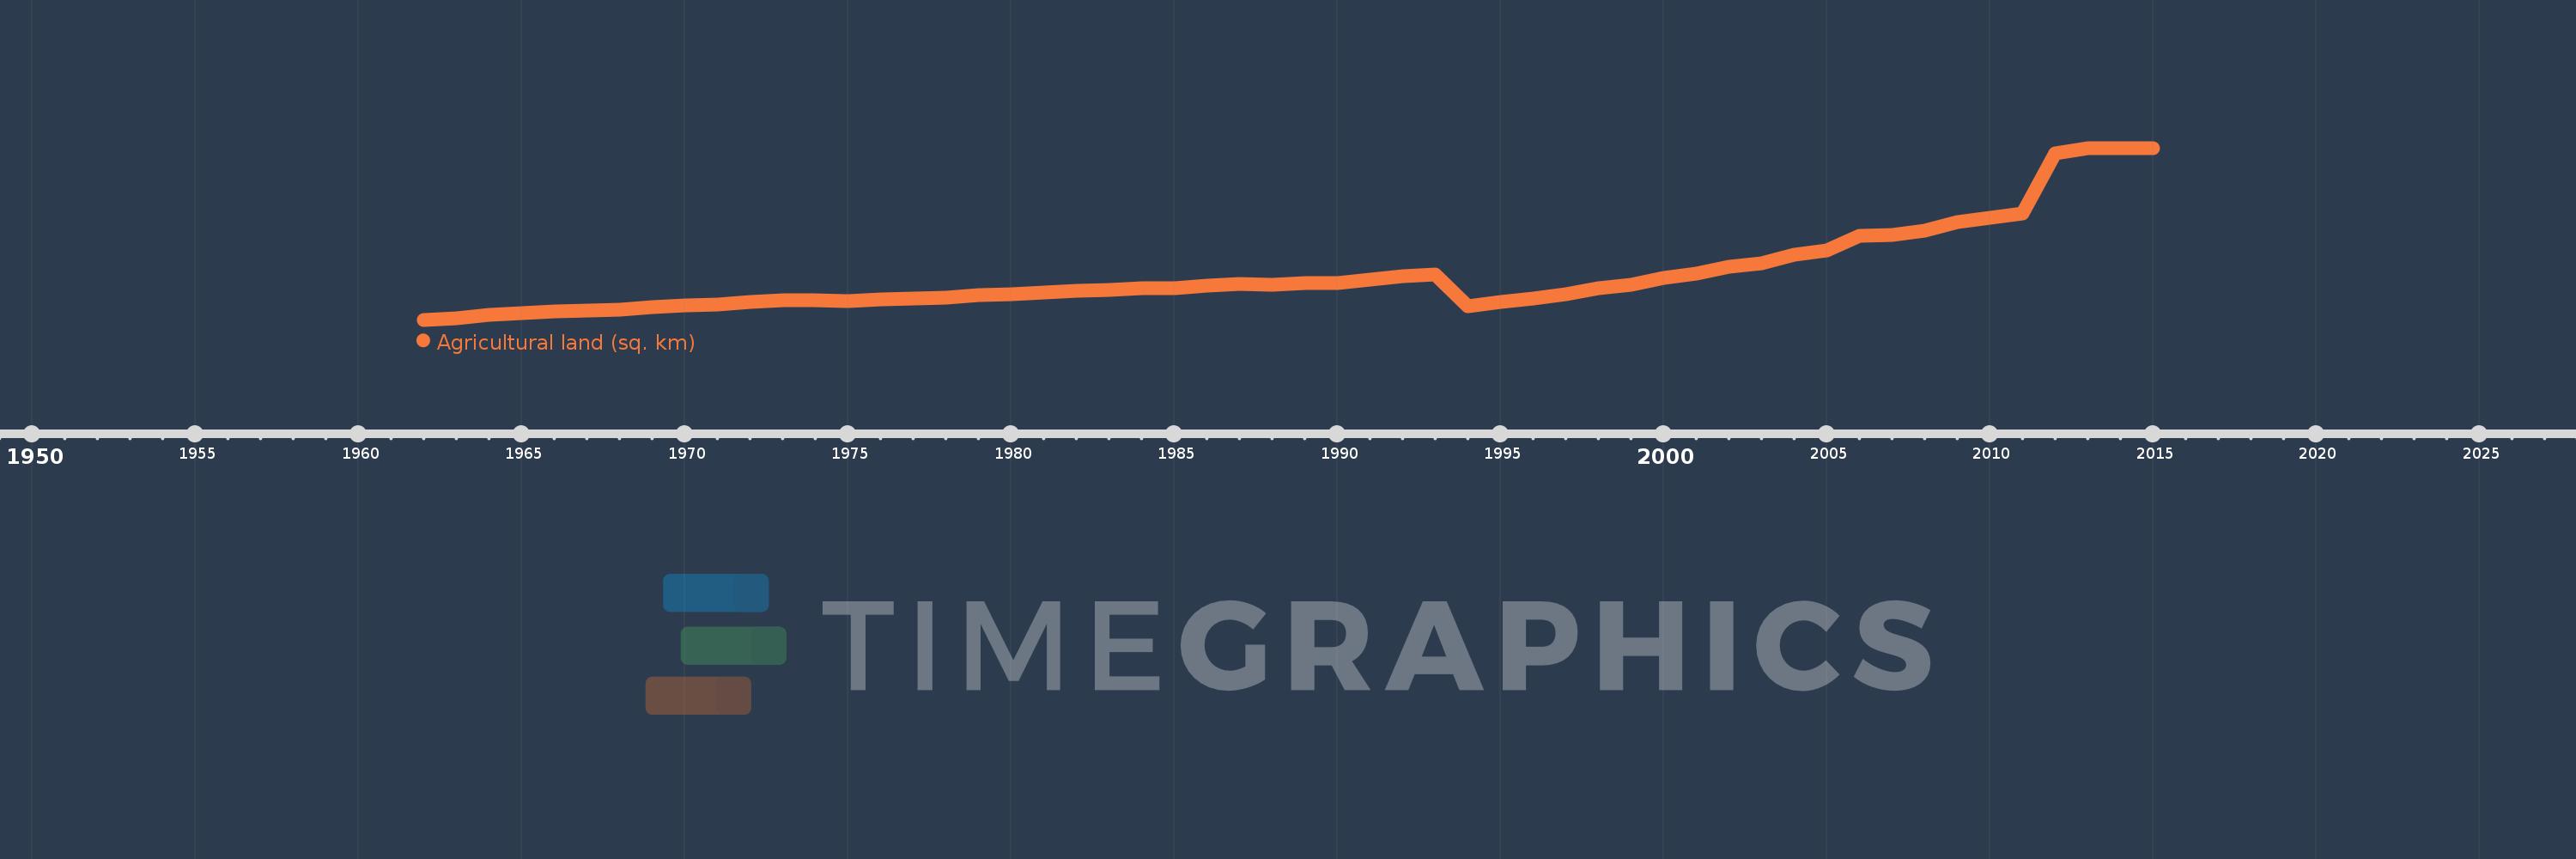
Agricultural land (sq. km)
2015,2014,2013,2012,2011,2010,2009,2008,2007,2006,2005,2004,2003,2002,2001,2000,1999,1998,1997,1996,1995,1994,1993,1992,1991,1990,1989,1988,1987,1986,1985,1984,1983,1982,1981,1980,1979,1978,1977,1976,1975,1974,1973,1972,1971,1970,1969,1968,1967,1966,1965,1964,1963,1962
This statistics in other country:
AfghanistanAlbaniaAlgeriaAmerican SamoaAndorraAngolaAntigua and BarbudaArab WorldArgentinaArmeniaArubaAustraliaAustriaAzerbaijanBahamas, TheBahrainBangladeshBarbadosBelarusBelgiumBelizeBeninBermudaBhutanBoliviaBosnia and HerzegovinaBotswanaBrazilBritish Virgin IslandsBrunei DarussalamBulgariaBurkina FasoBurundiCabo VerdeCambodiaCameroonCanadaCaribbean small statesCayman IslandsCentral African RepublicCentral Europe and the BalticsChadChannel IslandsChileChinaColombiaComorosCongo, Dem. Rep.Congo, Rep.Costa RicaCote d'IvoireCroatiaCubaCyprusCzech RepublicDenmarkDjiboutiDominicaDominican RepublicEarly-demographic dividendEast Asia & PacificEast Asia & Pacific (excluding high income)East Asia & Pacific (IDA & IBRD countries)EcuadorEgypt, Arab Rep.El SalvadorEquatorial GuineaEritreaEstoniaEthiopiaEuro areaEurope & Central AsiaEurope & Central Asia (excluding high income)Europe & Central Asia (IDA & IBRD countries)European UnionFaroe IslandsFijiFinlandFragile and conflict affected situationsFranceFrench PolynesiaGabonGambia, TheGeorgiaGermanyGhanaGreeceGreenlandGrenadaGuamGuatemalaGuineaGuinea-BissauGuyanaHaitiHeavily indebted poor countries (HIPC)High incomeHondurasHong Kong SAR, ChinaHungaryIBRD onlyIcelandIDA & IBRD totalIDA blendIDA onlyIDA totalIndiaIndonesiaIran, Islamic Rep.IraqIrelandIsle of ManIsraelItalyJamaicaJapanJordanKazakhstanKenyaKiribatiKorea, Dem. People’s Rep.Korea, Rep.KosovoKuwaitKyrgyz RepublicLao PDRLate-demographic dividendLatin America & Caribbean Latin America & Caribbean (excluding high income)Latin America & the Caribbean (IDA & IBRD countries)LatviaLeast developed countries: UN classificationLebanonLesothoLiberiaLibyaLiechtensteinLithuaniaLow & middle incomeLow incomeLower middle incomeLuxembourgMacedonia, FYRMadagascarMalawiMalaysiaMaldivesMaliMaltaMarshall IslandsMauritaniaMauritiusMexicoMicronesia, Fed. Sts.Middle East & North AfricaMiddle East & North Africa (excluding high income)Middle East & North Africa (IDA & IBRD countries)Middle incomeMoldovaMongoliaMontenegroMoroccoMozambiqueMyanmarNamibiaNauruNepalNetherlandsNew CaledoniaNew ZealandNicaraguaNigerNigeriaNorth AmericaNorthern Mariana IslandsNorwayOECD membersOmanOther small statesPacific island small statesPakistanPalauPanamaPapua New GuineaParaguayPeruPhilippinesPolandPortugalPost-demographic dividendPre-demographic dividendPuerto RicoQatarRomaniaRussian FederationRwandaSamoaSan MarinoSao Tome and PrincipeSaudi ArabiaSenegalSerbiaSeychellesSierra LeoneSingaporeSlovak RepublicSloveniaSmall statesSolomon IslandsSomaliaSouth AfricaSouth AsiaSouth Asia (IDA & IBRD)South SudanSpainSri LankaSt. Kitts and NevisSt. LuciaSt. Vincent and the GrenadinesSub-Saharan Africa Sub-Saharan Africa (excluding high income)Sub-Saharan Africa (IDA & IBRD countries)SudanSurinameSwazilandSwedenSwitzerlandSyrian Arab RepublicTajikistanTanzaniaThailandTimor-LesteTogoTongaTrinidad and TobagoTunisiaTurkeyTurkmenistanTurks and Caicos IslandsTuvaluUgandaUkraineUnited Arab EmiratesUnited KingdomUnited StatesUpper middle incomeUruguayUzbekistanVanuatuVenezuela, RBVietnamVirgin Islands (U.S.)West Bank and GazaWorldYemen, Rep.ZambiaZimbabwe Timeline:
This timeline shows a graph from 1962 to 2015 of Low income. No data until 1961. Number of actual observations by date: 54.
Source name:
World Development Indicators
Source organization:
Food and Agriculture Organization, electronic files and web site.
Categories, topics:
Agriculture & Rural Development, Climate Change
Last updated:
apr 23, 2017
Indicators value changes by year
Minimum:
4.649 mln
jan 1, 1962
Maximum:
5.539 mln
jan 1, 2013
At the date of observation
Value
Absolute change
Change from previous value
jan 1, 1962
4.649 mln
+4.649 mln
0.0%
jan 1, 1963
4.658 mln
+8.93K
0.19%
jan 1, 1964
4.675 mln
+16.96K
0.36%
jan 1, 1965
4.684 mln
+8.65K
0.19%
jan 1, 1966
4.692 mln
+8.4K
0.18%
jan 1, 1967
4.696 mln
+4.04K
0.09%
jan 1, 1968
4.701 mln
+5.05K
0.11%
jan 1, 1969
4.715 mln
+14.29K
0.3%
jan 1, 1970
4.722 mln
+7.1K
0.15%
jan 1, 1971
4.726 mln
+3.75K
0.08%
jan 1, 1972
4.742 mln
+15.93K
0.34%
jan 1, 1973
4.748 mln
+6.05K
0.13%
jan 1, 1974
4.751 mln
+3.04K
0.06%
jan 1, 1975
4.747 mln
-4.28K
-0.09%
jan 1, 1976
4.754 mln
+7.18K
0.15%
jan 1, 1977
4.76 mln
+6.25K
0.13%
jan 1, 1978
4.762 mln
+1.8K
0.04%
jan 1, 1979
4.777 mln
+14.94K
0.31%
jan 1, 1980
4.781 mln
+3.85K
0.08%
jan 1, 1981
4.789 mln
+8.52K
0.18%
jan 1, 1982
4.798 mln
+8.46K
0.18%
jan 1, 1983
4.801 mln
+3.506K
0.07%
jan 1, 1984
4.811 mln
+9.826K
0.2%
jan 1, 1985
4.811 mln
-444.0
-0.01%
jan 1, 1986
4.824 mln
+12.896K
0.27%
jan 1, 1987
4.833 mln
+9.136K
0.19%
jan 1, 1988
4.83 mln
-3.264K
-0.07%
jan 1, 1989
4.837 mln
+7.496K
0.16%
jan 1, 1990
4.839 mln
+1.576K
0.03%
jan 1, 1991
4.858 mln
+19.276K
0.4%
jan 1, 1992
4.873 mln
+15.586K
0.32%
jan 1, 1993
4.885 mln
+11.582K
0.24%
jan 1, 1994
4.718 mln
-167.278K
-3.42%
jan 1, 1995
4.74 mln
+22.672K
0.48%
jan 1, 1996
4.758 mln
+17.102K
0.36%
jan 1, 1997
4.783 mln
+25.142K
0.53%
jan 1, 1998
4.813 mln
+30.592K
0.64%
jan 1, 1999
4.831 mln
+18.132K
0.38%
jan 1, 2000
4.864 mln
+32.752K
0.68%
jan 1, 2001
4.888 mln
+23.965K
0.49%
jan 1, 2002
4.924 mln
+35.738K
0.73%
jan 1, 2003
4.943 mln
+19.472K
0.4%
jan 1, 2004
4.988 mln
+44.406K
0.9%
jan 1, 2005
5.009 mln
+21.259K
0.43%
jan 1, 2006
5.085 mln
+76.043K
1.52%
jan 1, 2007
5.09 mln
+4.727K
0.09%
jan 1, 2008
5.111 mln
+21.095K
0.41%
jan 1, 2009
5.156 mln
+45.032K
0.88%
jan 1, 2010
5.176 mln
+20.352K
0.39%
jan 1, 2011
5.199 mln
+22.697K
0.44%
jan 1, 2012
5.513 mln
+313.738K
6.03%
jan 1, 2013
5.539 mln
+25.915K
0.47%
jan 1, 2014
5.538 mln
-1.022K
-0.02%
jan 1, 2015
5.535 mln
-2.326K
-0.04%
Ranking of countries by current statistics by years


Comments: