29
/
en
AIzaSyAYiBZKx7MnpbEhh9jyipgxe19OcubqV5w
April 1, 2024
271849
Uganda
UGA
true
2
1
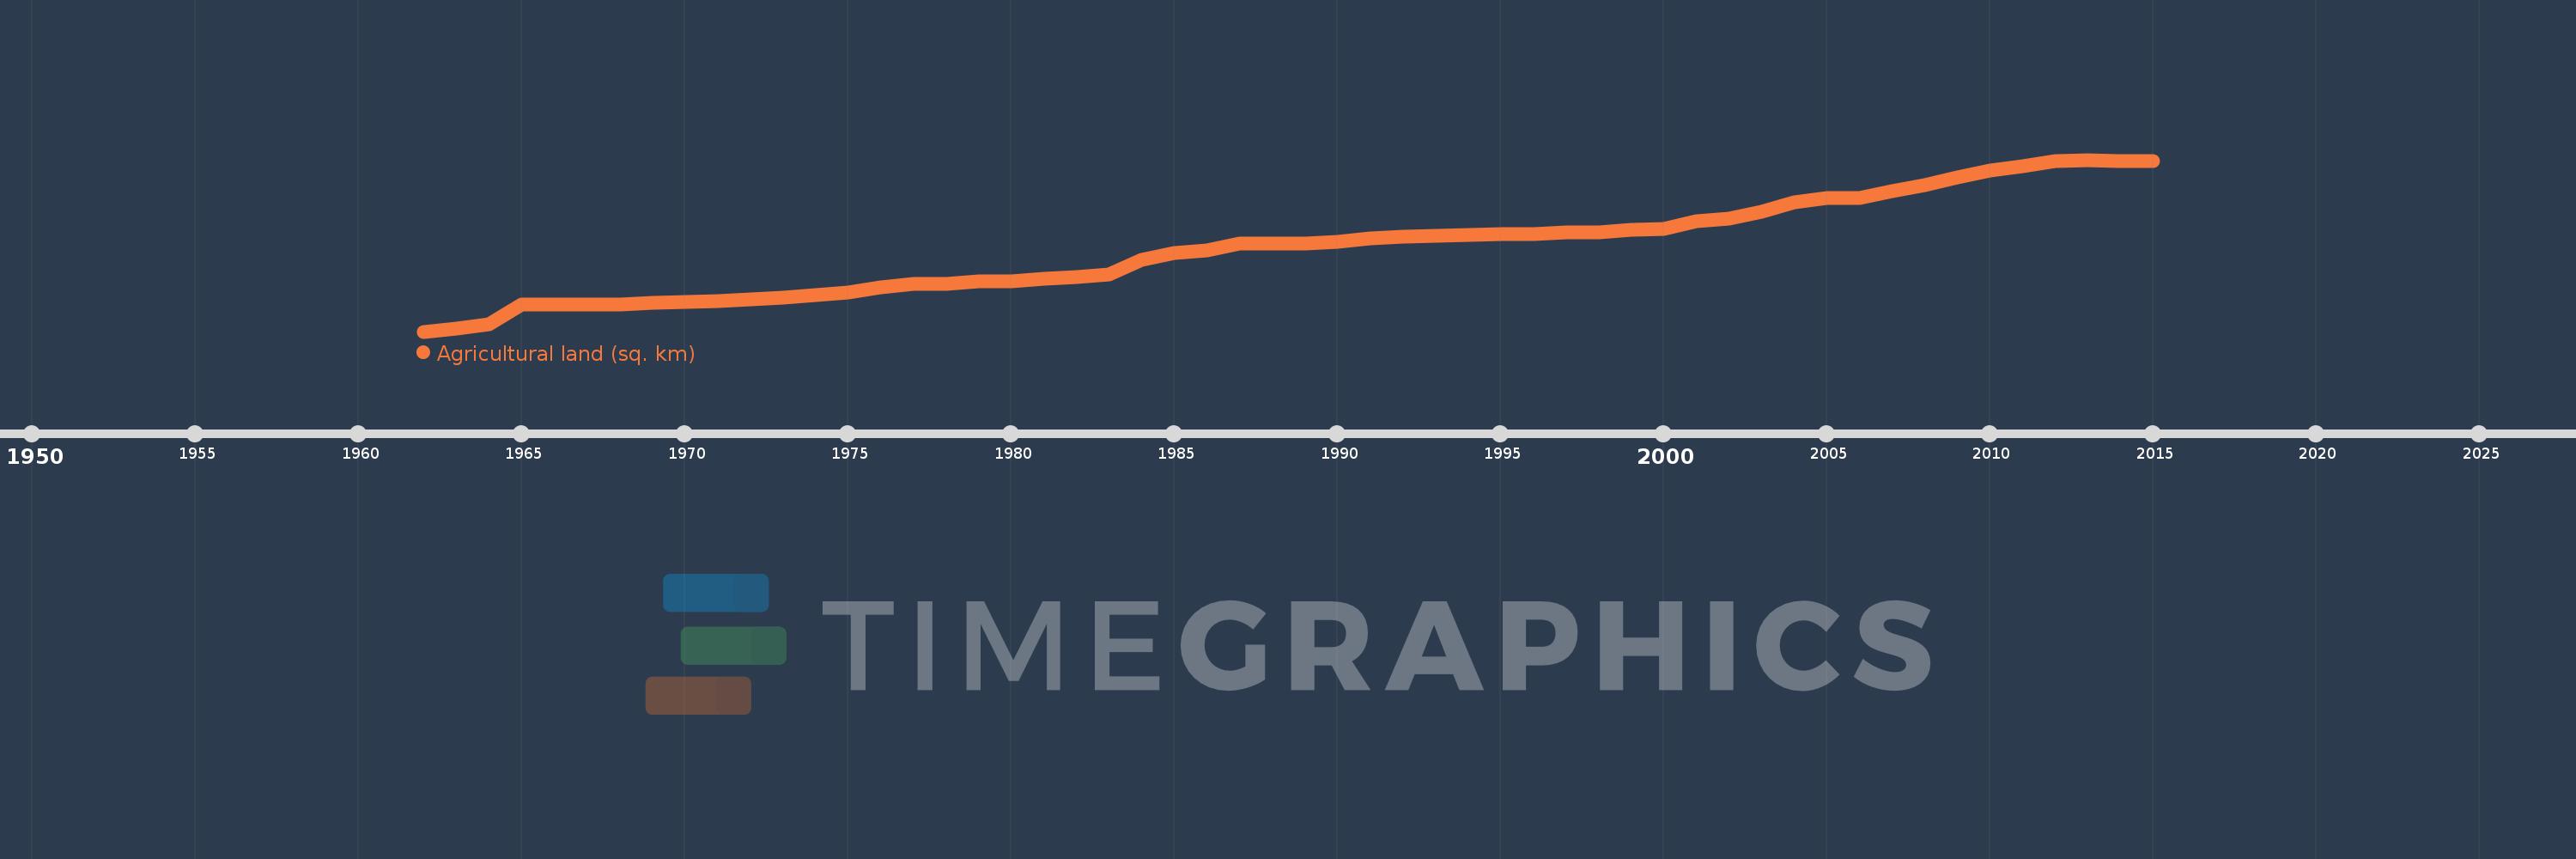
Agricultural land (sq. km)
2015,2014,2013,2012,2011,2010,2009,2008,2007,2006,2005,2004,2003,2002,2001,2000,1999,1998,1997,1996,1995,1994,1993,1992,1991,1990,1989,1988,1987,1986,1985,1984,1983,1982,1981,1980,1979,1978,1977,1976,1975,1974,1973,1972,1971,1970,1969,1968,1967,1966,1965,1964,1963,1962
This statistics in other country:
AfghanistanAlbaniaAlgeriaAmerican SamoaAndorraAngolaAntigua and BarbudaArab WorldArgentinaArmeniaArubaAustraliaAustriaAzerbaijanBahamas, TheBahrainBangladeshBarbadosBelarusBelgiumBelizeBeninBermudaBhutanBoliviaBosnia and HerzegovinaBotswanaBrazilBritish Virgin IslandsBrunei DarussalamBulgariaBurkina FasoBurundiCabo VerdeCambodiaCameroonCanadaCaribbean small statesCayman IslandsCentral African RepublicCentral Europe and the BalticsChadChannel IslandsChileChinaColombiaComorosCongo, Dem. Rep.Congo, Rep.Costa RicaCote d'IvoireCroatiaCubaCyprusCzech RepublicDenmarkDjiboutiDominicaDominican RepublicEarly-demographic dividendEast Asia & PacificEast Asia & Pacific (excluding high income)East Asia & Pacific (IDA & IBRD countries)EcuadorEgypt, Arab Rep.El SalvadorEquatorial GuineaEritreaEstoniaEthiopiaEuro areaEurope & Central AsiaEurope & Central Asia (excluding high income)Europe & Central Asia (IDA & IBRD countries)European UnionFaroe IslandsFijiFinlandFragile and conflict affected situationsFranceFrench PolynesiaGabonGambia, TheGeorgiaGermanyGhanaGreeceGreenlandGrenadaGuamGuatemalaGuineaGuinea-BissauGuyanaHaitiHeavily indebted poor countries (HIPC)High incomeHondurasHong Kong SAR, ChinaHungaryIBRD onlyIcelandIDA & IBRD totalIDA blendIDA onlyIDA totalIndiaIndonesiaIran, Islamic Rep.IraqIrelandIsle of ManIsraelItalyJamaicaJapanJordanKazakhstanKenyaKiribatiKorea, Dem. People’s Rep.Korea, Rep.KosovoKuwaitKyrgyz RepublicLao PDRLate-demographic dividendLatin America & Caribbean Latin America & Caribbean (excluding high income)Latin America & the Caribbean (IDA & IBRD countries)LatviaLeast developed countries: UN classificationLebanonLesothoLiberiaLibyaLiechtensteinLithuaniaLow & middle incomeLow incomeLower middle incomeLuxembourgMacedonia, FYRMadagascarMalawiMalaysiaMaldivesMaliMaltaMarshall IslandsMauritaniaMauritiusMexicoMicronesia, Fed. Sts.Middle East & North AfricaMiddle East & North Africa (excluding high income)Middle East & North Africa (IDA & IBRD countries)Middle incomeMoldovaMongoliaMontenegroMoroccoMozambiqueMyanmarNamibiaNauruNepalNetherlandsNew CaledoniaNew ZealandNicaraguaNigerNigeriaNorth AmericaNorthern Mariana IslandsNorwayOECD membersOmanOther small statesPacific island small statesPakistanPalauPanamaPapua New GuineaParaguayPeruPhilippinesPolandPortugalPost-demographic dividendPre-demographic dividendPuerto RicoQatarRomaniaRussian FederationRwandaSamoaSan MarinoSao Tome and PrincipeSaudi ArabiaSenegalSerbiaSeychellesSierra LeoneSingaporeSlovak RepublicSloveniaSmall statesSolomon IslandsSomaliaSouth AfricaSouth AsiaSouth Asia (IDA & IBRD)South SudanSpainSri LankaSt. Kitts and NevisSt. LuciaSt. Vincent and the GrenadinesSub-Saharan Africa Sub-Saharan Africa (excluding high income)Sub-Saharan Africa (IDA & IBRD countries)SudanSurinameSwazilandSwedenSwitzerlandSyrian Arab RepublicTajikistanTanzaniaThailandTimor-LesteTogoTongaTrinidad and TobagoTunisiaTurkeyTurkmenistanTurks and Caicos IslandsTuvaluUgandaUkraineUnited Arab EmiratesUnited KingdomUnited StatesUpper middle incomeUruguayUzbekistanVanuatuVenezuela, RBVietnamVirgin Islands (U.S.)West Bank and GazaWorldYemen, Rep.ZambiaZimbabwe Timeline:
This timeline shows a graph from 1962 to 2015 of Uganda. No data until 1961. Number of actual observations by date: 54.
Source name:
World Development Indicators
Source organization:
Food and Agriculture Organization, electronic files and web site.
Categories, topics:
Agriculture & Rural Development, Climate Change
Last updated:
apr 23, 2017
Indicators value changes by year
Minimum:
90.18K
jan 1, 1962
Maximum:
144.65K
jan 1, 2013
At the date of observation
Value
Absolute change
Change from previous value
jan 1, 1962
90.18K
+90.18K
0.0%
jan 1, 1963
91.14K
+960.0
1.06%
jan 1, 1964
92.58K
+1.44K
1.58%
jan 1, 1965
98.73K
+6.15K
6.64%
jan 1, 1966
98.71K
-20.0
-0.02%
jan 1, 1967
98.85K
+140.0
0.14%
jan 1, 1968
98.88K
+30.0
0.03%
jan 1, 1969
99.25K
+370.0
0.37%
jan 1, 1970
99.5K
+250.0
0.25%
jan 1, 1971
99.8K
+300.0
0.3%
jan 1, 1972
100.3K
+500.0
0.5%
jan 1, 1973
101.0K
+700.0
0.7%
jan 1, 1974
101.8K
+800.0
0.79%
jan 1, 1975
102.64K
+840.0
0.83%
jan 1, 1976
104.07K
+1.43K
1.39%
jan 1, 1977
105.38K
+1.31K
1.26%
jan 1, 1978
105.38K
0.0
0.0%
jan 1, 1979
106.1K
+720.0
0.68%
jan 1, 1980
106.1K
0.0
0.0%
jan 1, 1981
106.8K
+700.0
0.66%
jan 1, 1982
107.6K
+800.0
0.75%
jan 1, 1983
108.4K
+800.0
0.74%
jan 1, 1984
113.0K
+4.6K
4.24%
jan 1, 1985
115.0K
+2.0K
1.77%
jan 1, 1986
116.0K
+1000.0
0.87%
jan 1, 1987
118.17K
+2.17K
1.87%
jan 1, 1988
118.17K
0.0
0.0%
jan 1, 1989
118.17K
0.0
0.0%
jan 1, 1990
118.62K
+450.0
0.38%
jan 1, 1991
119.62K
+1000.0
0.84%
jan 1, 1992
120.32K
+700.0
0.59%
jan 1, 1993
120.52K
+200.0
0.17%
jan 1, 1994
120.82K
+300.0
0.25%
jan 1, 1995
121.02K
+200.0
0.17%
jan 1, 1996
121.22K
+200.0
0.17%
jan 1, 1997
121.72K
+500.0
0.41%
jan 1, 1998
121.72K
0.0
0.0%
jan 1, 1999
122.42K
+700.0
0.58%
jan 1, 2000
122.62K
+200.0
0.16%
jan 1, 2001
125.12K
+2.5K
2.04%
jan 1, 2002
126.12K
+1000.0
0.8%
jan 1, 2003
128.12K
+2.0K
1.59%
jan 1, 2004
131.12K
+3.0K
2.34%
jan 1, 2005
132.62K
+1.5K
1.14%
jan 1, 2006
132.62K
0.0
0.0%
jan 1, 2007
134.627K
+2.007K
1.51%
jan 1, 2008
136.635K
+2.007K
1.49%
jan 1, 2009
139.143K
+2.507K
1.84%
jan 1, 2010
141.15K
+2.007K
1.44%
jan 1, 2011
142.65K
+1.5K
1.06%
jan 1, 2012
144.15K
+1.5K
1.05%
jan 1, 2013
144.65K
+500.0
0.35%
jan 1, 2014
144.15K
-500.0
-0.35%
jan 1, 2015
144.15K
0.0
0.0%
Ranking of countries by current statistics by years


Comments: