29
/
en
AIzaSyAYiBZKx7MnpbEhh9jyipgxe19OcubqV5w
April 1, 2024
30628
Europe & Central Asia
ECS
false
2
1
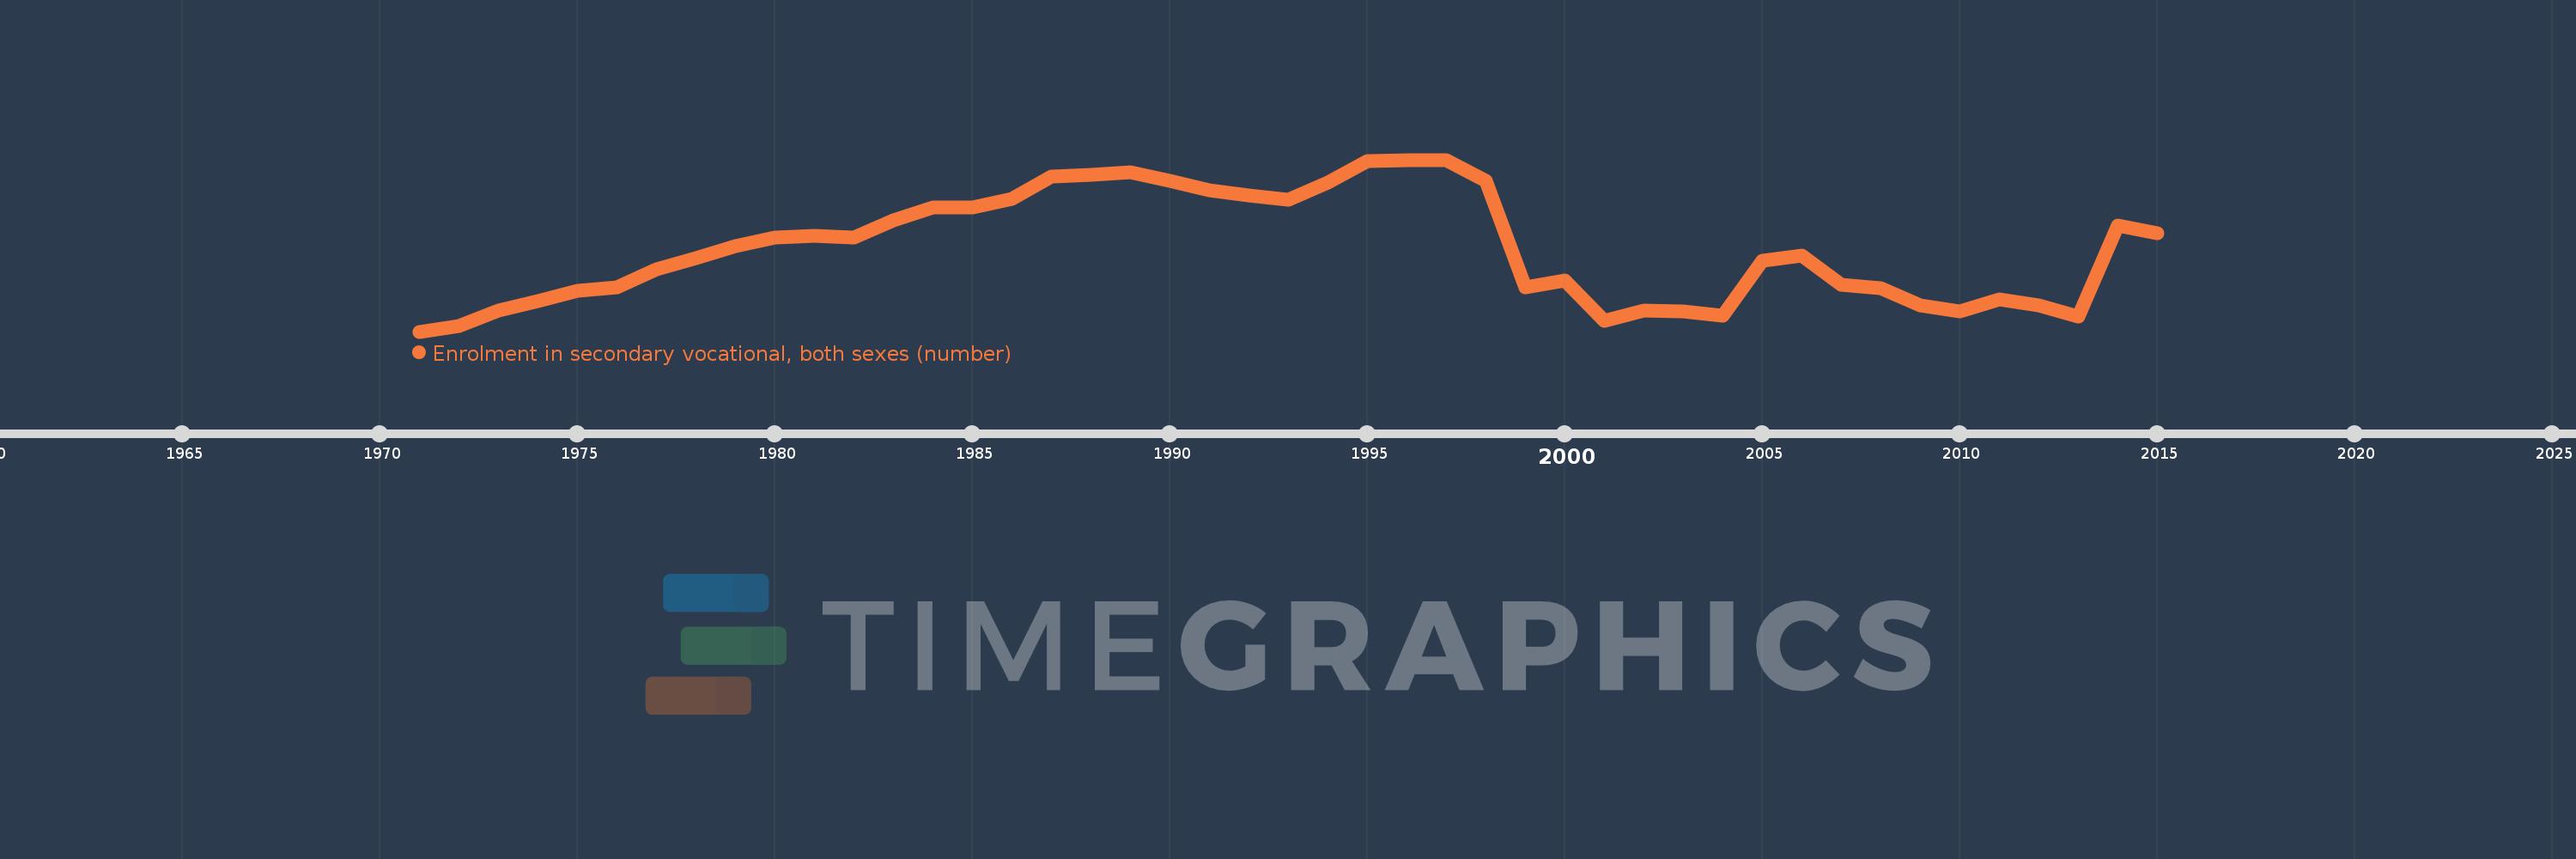
Enrolment in secondary vocational, both sexes (number)
2015,2014,2013,2012,2011,2010,2009,2008,2007,2006,2005,2004,2003,2002,2001,2000,1999,1998,1997,1996,1995,1994,1993,1992,1991,1990,1989,1988,1987,1986,1985,1984,1983,1982,1981,1980,1979,1978,1977,1976,1975,1974,1973,1972,1971
This statistics in other country:
AfghanistanAlbaniaAlgeriaAmerican SamoaAndorraAngolaAntigua and BarbudaArab WorldArgentinaArmeniaArubaAustraliaAustriaAzerbaijanBahamas, TheBahrainBangladeshBarbadosBelarusBelgiumBelizeBeninBermudaBhutanBoliviaBosnia and HerzegovinaBotswanaBrazilBritish Virgin IslandsBrunei DarussalamBulgariaBurkina FasoBurundiCabo VerdeCambodiaCameroonCanadaCaribbean small statesCayman IslandsCentral African RepublicCentral Europe and the BalticsChadChileChinaColombiaComorosCongo, Dem. Rep.Congo, Rep.Costa RicaCote d'IvoireCroatiaCubaCuracaoCyprusCzech RepublicDenmarkDjiboutiDominicaDominican RepublicEarly-demographic dividendEast Asia & PacificEast Asia & Pacific (excluding high income)East Asia & Pacific (IDA & IBRD countries)EcuadorEgypt, Arab Rep.El SalvadorEquatorial GuineaEritreaEstoniaEthiopiaEuro areaEurope & Central AsiaEurope & Central Asia (excluding high income)Europe & Central Asia (IDA & IBRD countries)European UnionFaroe IslandsFijiFinlandFragile and conflict affected situationsFranceFrench PolynesiaGabonGambia, TheGeorgiaGermanyGhanaGibraltarGreeceGrenadaGuamGuatemalaGuineaGuinea-BissauGuyanaHaitiHeavily indebted poor countries (HIPC)High incomeHondurasHong Kong SAR, ChinaHungaryIBRD onlyIcelandIDA & IBRD totalIDA blendIDA onlyIDA totalIndiaIndonesiaIran, Islamic Rep.IraqIrelandIsraelItalyJamaicaJapanJordanKazakhstanKenyaKiribatiKorea, Rep.KuwaitKyrgyz RepublicLao PDRLate-demographic dividendLatin America & Caribbean Latin America & Caribbean (excluding high income)Latin America & the Caribbean (IDA & IBRD countries)LatviaLeast developed countries: UN classificationLebanonLesothoLiberiaLibyaLiechtensteinLithuaniaLow & middle incomeLow incomeLower middle incomeLuxembourgMacao SAR, ChinaMacedonia, FYRMadagascarMalawiMalaysiaMaldivesMaliMaltaMarshall IslandsMauritaniaMauritiusMexicoMicronesia, Fed. Sts.Middle East & North AfricaMiddle East & North Africa (excluding high income)Middle East & North Africa (IDA & IBRD countries)Middle incomeMoldovaMonacoMongoliaMontenegroMoroccoMozambiqueMyanmarNamibiaNauruNepalNetherlandsNew CaledoniaNew ZealandNicaraguaNigerNigeriaNorth AmericaNorwayOECD membersOmanOther small statesPacific island small statesPakistanPanamaPapua New GuineaParaguayPeruPhilippinesPolandPortugalPost-demographic dividendPre-demographic dividendPuerto RicoQatarRomaniaRussian FederationRwandaSamoaSan MarinoSao Tome and PrincipeSaudi ArabiaSenegalSerbiaSeychellesSierra LeoneSingaporeSint Maarten (Dutch part)Slovak RepublicSloveniaSmall statesSolomon IslandsSomaliaSouth AfricaSouth AsiaSouth Asia (IDA & IBRD)SpainSri LankaSt. Kitts and NevisSt. LuciaSt. Vincent and the GrenadinesSub-Saharan Africa Sub-Saharan Africa (excluding high income)Sub-Saharan Africa (IDA & IBRD countries)SudanSurinameSwazilandSwedenSwitzerlandSyrian Arab RepublicTajikistanTanzaniaThailandTimor-LesteTogoTongaTrinidad and TobagoTunisiaTurkeyTurkmenistanTurks and Caicos IslandsTuvaluUgandaUkraineUnited Arab EmiratesUnited KingdomUnited StatesUpper middle incomeUruguayUzbekistanVanuatuVenezuela, RBVietnamVirgin Islands (U.S.)West Bank and GazaWorldYemen, Rep.ZambiaZimbabwe Timeline:
This timeline shows a graph from 1971 to 2015 of Europe & Central Asia. No data until 1970. Number of actual observations by date: 45.
Source name:
World Development Indicators
Source organization:
UNESCO Institute for Statistics
Categories, topics:
Education
Last updated:
apr 23, 2017
Indicators value changes by year
Minimum:
15.337 mln
jan 1, 1971
Maximum:
19.725 mln
jan 1, 1996
At the date of observation
Value
Absolute change
Change from previous value
jan 1, 1971
15.337 mln
+15.337 mln
0.0%
jan 1, 1972
15.482 mln
+144.492K
0.94%
jan 1, 1973
15.867 mln
+385.3K
2.49%
jan 1, 1974
16.12 mln
+252.712K
1.59%
jan 1, 1975
16.379 mln
+259.016K
1.61%
jan 1, 1976
16.476 mln
+97.187K
0.59%
jan 1, 1977
16.937 mln
+461.321K
2.8%
jan 1, 1978
17.223 mln
+285.55K
1.69%
jan 1, 1979
17.527 mln
+304.46K
1.77%
jan 1, 1980
17.732 mln
+205.094K
1.17%
jan 1, 1981
17.794 mln
+61.17K
0.34%
jan 1, 1982
17.748 mln
-45.86K
-0.26%
jan 1, 1983
18.184 mln
+435.928K
2.46%
jan 1, 1984
18.511 mln
+327.538K
1.8%
jan 1, 1985
18.511 mln
0.0
0.0%
jan 1, 1986
18.721 mln
+210.212K
1.14%
jan 1, 1987
19.287 mln
+565.38K
3.02%
jan 1, 1988
19.343 mln
+56.11K
0.29%
jan 1, 1989
19.403 mln
+60.416K
0.31%
jan 1, 1990
19.186 mln
-216.87K
-1.12%
jan 1, 1991
18.95 mln
-236.52K
-1.23%
jan 1, 1992
18.815 mln
-134.636K
-0.71%
jan 1, 1993
18.704 mln
-111.808K
-0.59%
jan 1, 1994
19.141 mln
+437.838K
2.34%
jan 1, 1995
19.699 mln
+557.772K
2.91%
jan 1, 1996
19.725 mln
+25.744K
0.13%
jan 1, 1997
19.717 mln
-7.684K
-0.04%
jan 1, 1998
19.198 mln
-519.63K
-2.64%
jan 1, 1999
16.467 mln
-2.73 mln
-14.22%
jan 1, 2000
16.642 mln
+174.307K
1.06%
jan 1, 2001
15.607 mln
-1.035 mln
-6.22%
jan 1, 2002
15.884 mln
+277.55K
1.78%
jan 1, 2003
15.859 mln
-25.02K
-0.16%
jan 1, 2004
15.741 mln
-118.164K
-0.75%
jan 1, 2005
17.139 mln
+1.398 mln
8.88%
jan 1, 2006
17.282 mln
+142.708K
0.83%
jan 1, 2007
16.528 mln
-754.195K
-4.36%
jan 1, 2008
16.439 mln
-89.412K
-0.54%
jan 1, 2009
16.01 mln
-428.845K
-2.61%
jan 1, 2010
15.861 mln
-148.796K
-0.93%
jan 1, 2011
16.17 mln
+308.811K
1.95%
jan 1, 2012
16.006 mln
-164.127K
-1.02%
jan 1, 2013
15.725 mln
-280.736K
-1.75%
jan 1, 2014
18.045 mln
+2.32 mln
14.76%
jan 1, 2015
17.838 mln
-206.884K
-1.15%
Ranking of countries by current statistics by years


Comments: