29
/
en
AIzaSyAYiBZKx7MnpbEhh9jyipgxe19OcubqV5w
April 1, 2024
118844
Denmark
DNK
true
2
1
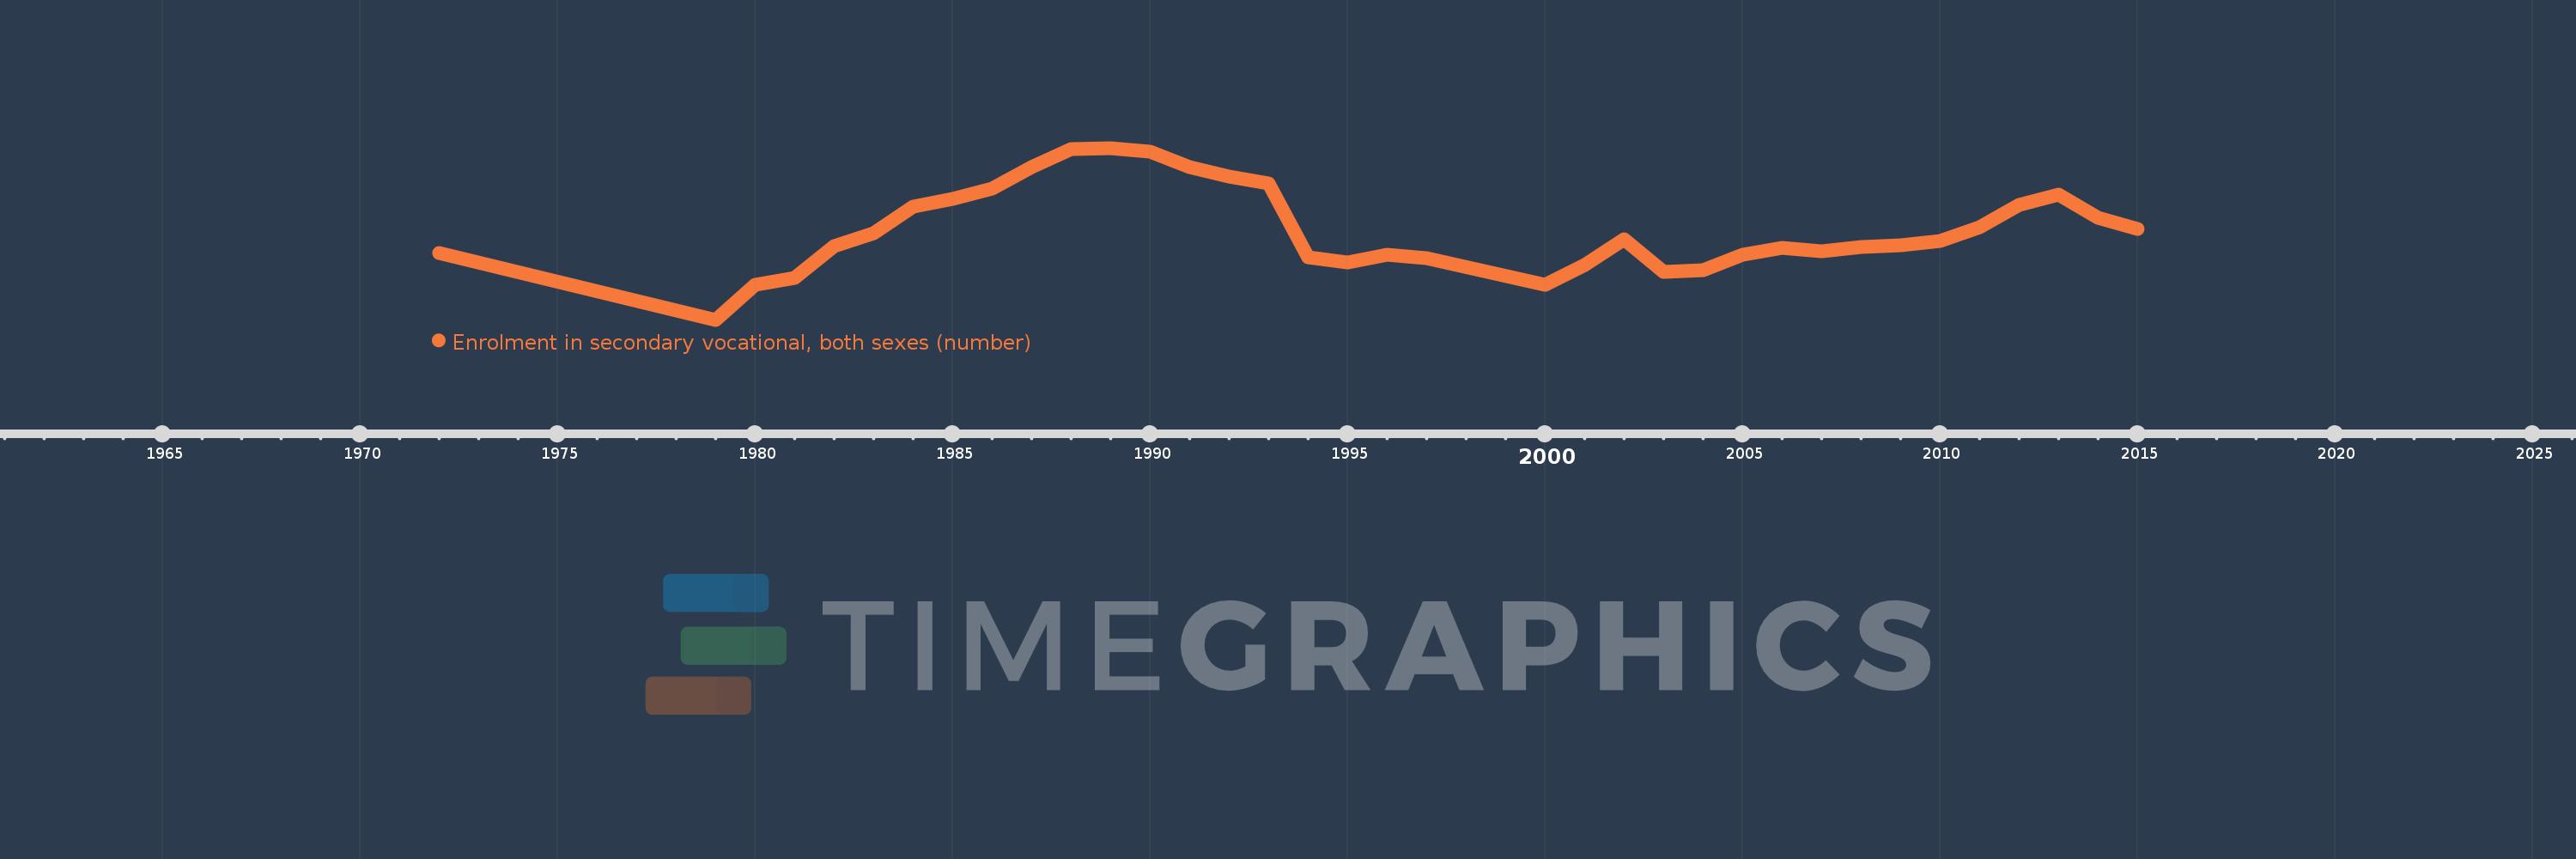
Enrolment in secondary vocational, both sexes (number)
2015,2014,2013,2012,2011,2010,2009,2008,2007,2006,2005,2004,2003,2002,2001,2000,1997,1996,1995,1994,1993,1992,1991,1990,1989,1988,1987,1986,1985,1984,1983,1982,1981,1980,1979,1972
This statistics in other country:
AfghanistanAlbaniaAlgeriaAmerican SamoaAndorraAngolaAntigua and BarbudaArab WorldArgentinaArmeniaArubaAustraliaAustriaAzerbaijanBahamas, TheBahrainBangladeshBarbadosBelarusBelgiumBelizeBeninBermudaBhutanBoliviaBosnia and HerzegovinaBotswanaBrazilBritish Virgin IslandsBrunei DarussalamBulgariaBurkina FasoBurundiCabo VerdeCambodiaCameroonCanadaCaribbean small statesCayman IslandsCentral African RepublicCentral Europe and the BalticsChadChileChinaColombiaComorosCongo, Dem. Rep.Congo, Rep.Costa RicaCote d'IvoireCroatiaCubaCuracaoCyprusCzech RepublicDenmarkDjiboutiDominicaDominican RepublicEarly-demographic dividendEast Asia & PacificEast Asia & Pacific (excluding high income)East Asia & Pacific (IDA & IBRD countries)EcuadorEgypt, Arab Rep.El SalvadorEquatorial GuineaEritreaEstoniaEthiopiaEuro areaEurope & Central AsiaEurope & Central Asia (excluding high income)Europe & Central Asia (IDA & IBRD countries)European UnionFaroe IslandsFijiFinlandFragile and conflict affected situationsFranceFrench PolynesiaGabonGambia, TheGeorgiaGermanyGhanaGibraltarGreeceGrenadaGuamGuatemalaGuineaGuinea-BissauGuyanaHaitiHeavily indebted poor countries (HIPC)High incomeHondurasHong Kong SAR, ChinaHungaryIBRD onlyIcelandIDA & IBRD totalIDA blendIDA onlyIDA totalIndiaIndonesiaIran, Islamic Rep.IraqIrelandIsraelItalyJamaicaJapanJordanKazakhstanKenyaKiribatiKorea, Rep.KuwaitKyrgyz RepublicLao PDRLate-demographic dividendLatin America & Caribbean Latin America & Caribbean (excluding high income)Latin America & the Caribbean (IDA & IBRD countries)LatviaLeast developed countries: UN classificationLebanonLesothoLiberiaLibyaLiechtensteinLithuaniaLow & middle incomeLow incomeLower middle incomeLuxembourgMacao SAR, ChinaMacedonia, FYRMadagascarMalawiMalaysiaMaldivesMaliMaltaMarshall IslandsMauritaniaMauritiusMexicoMicronesia, Fed. Sts.Middle East & North AfricaMiddle East & North Africa (excluding high income)Middle East & North Africa (IDA & IBRD countries)Middle incomeMoldovaMonacoMongoliaMontenegroMoroccoMozambiqueMyanmarNamibiaNauruNepalNetherlandsNew CaledoniaNew ZealandNicaraguaNigerNigeriaNorth AmericaNorwayOECD membersOmanOther small statesPacific island small statesPakistanPanamaPapua New GuineaParaguayPeruPhilippinesPolandPortugalPost-demographic dividendPre-demographic dividendPuerto RicoQatarRomaniaRussian FederationRwandaSamoaSan MarinoSao Tome and PrincipeSaudi ArabiaSenegalSerbiaSeychellesSierra LeoneSingaporeSint Maarten (Dutch part)Slovak RepublicSloveniaSmall statesSolomon IslandsSomaliaSouth AfricaSouth AsiaSouth Asia (IDA & IBRD)SpainSri LankaSt. Kitts and NevisSt. LuciaSt. Vincent and the GrenadinesSub-Saharan Africa Sub-Saharan Africa (excluding high income)Sub-Saharan Africa (IDA & IBRD countries)SudanSurinameSwazilandSwedenSwitzerlandSyrian Arab RepublicTajikistanTanzaniaThailandTimor-LesteTogoTongaTrinidad and TobagoTunisiaTurkeyTurkmenistanTurks and Caicos IslandsTuvaluUgandaUkraineUnited Arab EmiratesUnited KingdomUnited StatesUpper middle incomeUruguayUzbekistanVanuatuVenezuela, RBVietnamVirgin Islands (U.S.)West Bank and GazaWorldYemen, Rep.ZambiaZimbabwe Timeline:
This timeline shows a graph from 1972 to 2015 of Denmark. No data until 1971. Number of actual observations by date: 36.
Source name:
World Development Indicators
Source organization:
UNESCO Institute for Statistics
Categories, topics:
Education
Last updated:
apr 23, 2017
Indicators value changes by year
Minimum:
102.686K
jan 1, 1979
Maximum:
156.807K
jan 1, 1989
At the date of observation
Value
Absolute change
Change from previous value
jan 1, 1972
123.639K
+123.639K
0.0%
jan 1, 1979
102.686K
-20.953K
-16.95%
jan 1, 1980
113.718K
+11.032K
10.74%
jan 1, 1981
115.914K
+2.196K
1.93%
jan 1, 1982
125.996K
+10.082K
8.7%
jan 1, 1983
129.898K
+3.902K
3.1%
jan 1, 1984
138.296K
+8.398K
6.47%
jan 1, 1985
140.859K
+2.563K
1.85%
jan 1, 1986
144.024K
+3.165K
2.25%
jan 1, 1987
150.772K
+6.748K
4.69%
jan 1, 1988
156.511K
+5.739K
3.81%
jan 1, 1989
156.807K
+296.0
0.19%
jan 1, 1990
155.772K
-1.035K
-0.66%
jan 1, 1991
150.897K
-4.875K
-3.13%
jan 1, 1992
147.807K
-3.09K
-2.05%
jan 1, 1993
145.59K
-2.217K
-1.5%
jan 1, 1994
122.421K
-23.169K
-15.91%
jan 1, 1995
120.638K
-1.783K
-1.46%
jan 1, 1996
123.234K
+2.596K
2.15%
jan 1, 1997
122.059K
-1.175K
-0.95%
jan 1, 2000
113.728K
-8.331K
-6.83%
jan 1, 2001
119.878K
+6.15K
5.41%
jan 1, 2002
128.125K
+8.247K
6.88%
jan 1, 2003
117.695K
-10.43K
-8.14%
jan 1, 2004
118.329K
+634.0
0.54%
jan 1, 2005
123.103K
+4.774K
4.03%
jan 1, 2006
125.366K
+2.263K
1.84%
jan 1, 2007
124.271K
-1.095K
-0.87%
jan 1, 2008
125.715K
+1.444K
1.16%
jan 1, 2009
126.067K
+352.0
0.28%
jan 1, 2010
127.555K
+1.488K
1.18%
jan 1, 2011
131.952K
+4.397K
3.45%
jan 1, 2012
138.745K
+6.793K
5.15%
jan 1, 2013
142.027K
+3.282K
2.37%
jan 1, 2014
134.687K
-7.34K
-5.17%
jan 1, 2015
131.279K
-3.408K
-2.53%
Ranking of countries by current statistics by years


Comments: