29
/
en
AIzaSyAYiBZKx7MnpbEhh9jyipgxe19OcubqV5w
April 1, 2024
123411
Ecuador
ECU
true
2
1
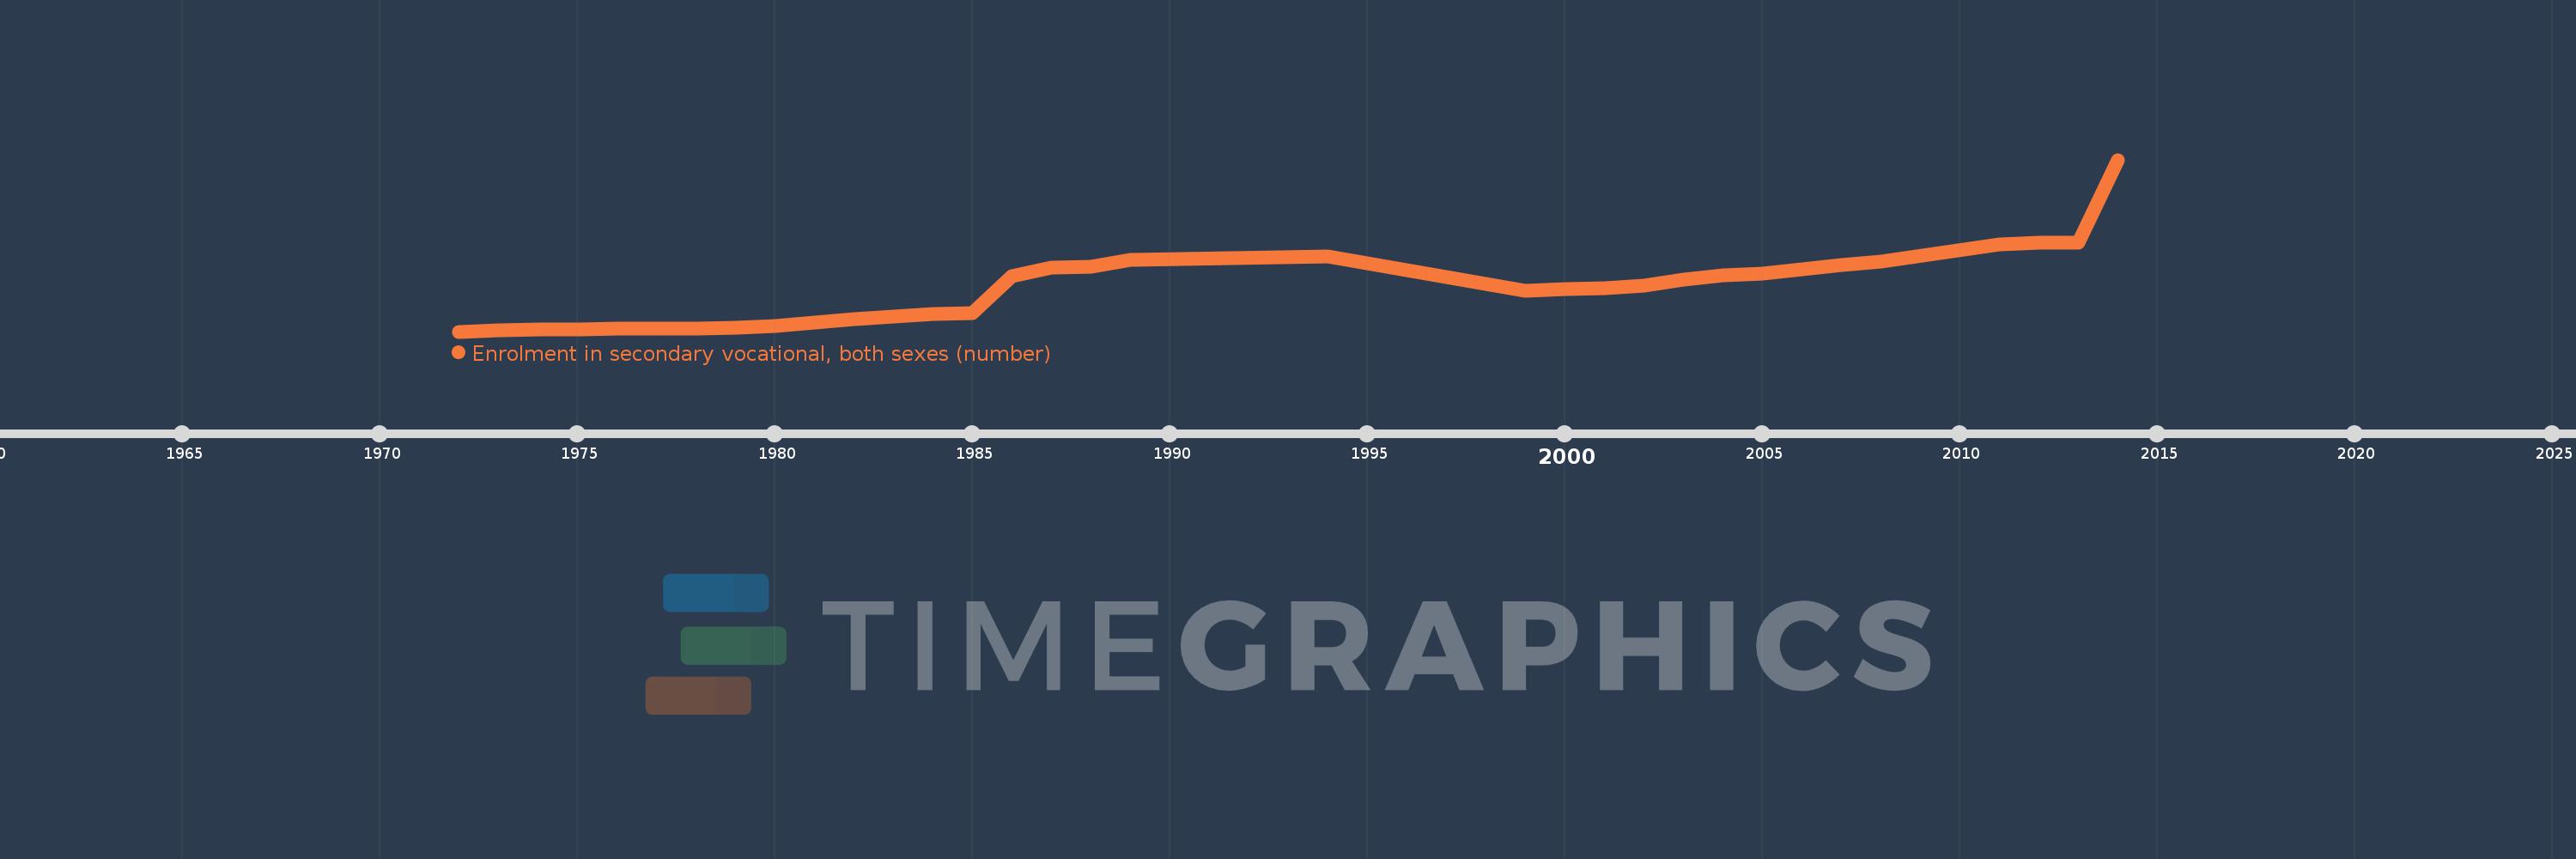
Enrolment in secondary vocational, both sexes (number)
2014,2013,2012,2011,2008,2007,2006,2005,2004,2003,2002,2001,2000,1999,1994,1989,1988,1987,1986,1985,1984,1983,1982,1981,1980,1979,1978,1977,1976,1975,1974,1973,1972
This statistics in other country:
AfghanistanAlbaniaAlgeriaAmerican SamoaAndorraAngolaAntigua and BarbudaArab WorldArgentinaArmeniaArubaAustraliaAustriaAzerbaijanBahamas, TheBahrainBangladeshBarbadosBelarusBelgiumBelizeBeninBermudaBhutanBoliviaBosnia and HerzegovinaBotswanaBrazilBritish Virgin IslandsBrunei DarussalamBulgariaBurkina FasoBurundiCabo VerdeCambodiaCameroonCanadaCaribbean small statesCayman IslandsCentral African RepublicCentral Europe and the BalticsChadChileChinaColombiaComorosCongo, Dem. Rep.Congo, Rep.Costa RicaCote d'IvoireCroatiaCubaCuracaoCyprusCzech RepublicDenmarkDjiboutiDominicaDominican RepublicEarly-demographic dividendEast Asia & PacificEast Asia & Pacific (excluding high income)East Asia & Pacific (IDA & IBRD countries)EcuadorEgypt, Arab Rep.El SalvadorEquatorial GuineaEritreaEstoniaEthiopiaEuro areaEurope & Central AsiaEurope & Central Asia (excluding high income)Europe & Central Asia (IDA & IBRD countries)European UnionFaroe IslandsFijiFinlandFragile and conflict affected situationsFranceFrench PolynesiaGabonGambia, TheGeorgiaGermanyGhanaGibraltarGreeceGrenadaGuamGuatemalaGuineaGuinea-BissauGuyanaHaitiHeavily indebted poor countries (HIPC)High incomeHondurasHong Kong SAR, ChinaHungaryIBRD onlyIcelandIDA & IBRD totalIDA blendIDA onlyIDA totalIndiaIndonesiaIran, Islamic Rep.IraqIrelandIsraelItalyJamaicaJapanJordanKazakhstanKenyaKiribatiKorea, Rep.KuwaitKyrgyz RepublicLao PDRLate-demographic dividendLatin America & Caribbean Latin America & Caribbean (excluding high income)Latin America & the Caribbean (IDA & IBRD countries)LatviaLeast developed countries: UN classificationLebanonLesothoLiberiaLibyaLiechtensteinLithuaniaLow & middle incomeLow incomeLower middle incomeLuxembourgMacao SAR, ChinaMacedonia, FYRMadagascarMalawiMalaysiaMaldivesMaliMaltaMarshall IslandsMauritaniaMauritiusMexicoMicronesia, Fed. Sts.Middle East & North AfricaMiddle East & North Africa (excluding high income)Middle East & North Africa (IDA & IBRD countries)Middle incomeMoldovaMonacoMongoliaMontenegroMoroccoMozambiqueMyanmarNamibiaNauruNepalNetherlandsNew CaledoniaNew ZealandNicaraguaNigerNigeriaNorth AmericaNorwayOECD membersOmanOther small statesPacific island small statesPakistanPanamaPapua New GuineaParaguayPeruPhilippinesPolandPortugalPost-demographic dividendPre-demographic dividendPuerto RicoQatarRomaniaRussian FederationRwandaSamoaSan MarinoSao Tome and PrincipeSaudi ArabiaSenegalSerbiaSeychellesSierra LeoneSingaporeSint Maarten (Dutch part)Slovak RepublicSloveniaSmall statesSolomon IslandsSomaliaSouth AfricaSouth AsiaSouth Asia (IDA & IBRD)SpainSri LankaSt. Kitts and NevisSt. LuciaSt. Vincent and the GrenadinesSub-Saharan Africa Sub-Saharan Africa (excluding high income)Sub-Saharan Africa (IDA & IBRD countries)SudanSurinameSwazilandSwedenSwitzerlandSyrian Arab RepublicTajikistanTanzaniaThailandTimor-LesteTogoTongaTrinidad and TobagoTunisiaTurkeyTurkmenistanTurks and Caicos IslandsTuvaluUgandaUkraineUnited Arab EmiratesUnited KingdomUnited StatesUpper middle incomeUruguayUzbekistanVanuatuVenezuela, RBVietnamVirgin Islands (U.S.)West Bank and GazaWorldYemen, Rep.ZambiaZimbabwe Timeline:
This timeline shows a graph from 1972 to 2014 of Ecuador. No data until 1971. Number of actual observations by date: 33.
Source name:
World Development Indicators
Source organization:
UNESCO Institute for Statistics
Categories, topics:
Education
Last updated:
apr 23, 2017
Indicators value changes by year
Minimum:
34.213K
jan 1, 1972
Maximum:
593.331K
jan 1, 2014
At the date of observation
Value
Absolute change
Change from previous value
jan 1, 1972
34.213K
+34.213K
0.0%
jan 1, 1973
39.31K
+5.097K
14.9%
jan 1, 1974
41.843K
+2.533K
6.44%
jan 1, 1975
42.262K
+419.0
1.0%
jan 1, 1976
42.721K
+459.0
1.09%
jan 1, 1977
43.853K
+1.132K
2.65%
jan 1, 1978
44.989K
+1.136K
2.59%
jan 1, 1979
47.964K
+2.975K
6.61%
jan 1, 1980
52.752K
+4.788K
9.98%
jan 1, 1981
64.433K
+11.681K
22.14%
jan 1, 1982
75.421K
+10.988K
17.05%
jan 1, 1983
82.086K
+6.665K
8.84%
jan 1, 1984
91.172K
+9.086K
11.07%
jan 1, 1985
94.746K
+3.574K
3.92%
jan 1, 1986
215.923K
+121.177K
127.9%
jan 1, 1987
242.148K
+26.225K
12.15%
jan 1, 1988
245.89K
+3.742K
1.55%
jan 1, 1989
267.447K
+21.557K
8.77%
jan 1, 1994
279.991K
+12.544K
4.69%
jan 1, 1999
165.84K
-114.151K
-40.77%
jan 1, 2000
173.703K
+7.863K
4.74%
jan 1, 2001
176.179K
+2.476K
1.43%
jan 1, 2002
185.166K
+8.987K
5.1%
jan 1, 2003
203.179K
+18.013K
9.73%
jan 1, 2004
215.933K
+12.754K
6.28%
jan 1, 2005
222.704K
+6.771K
3.14%
jan 1, 2006
238.063K
+15.359K
6.9%
jan 1, 2007
251.119K
+13.056K
5.48%
jan 1, 2008
261.438K
+10.319K
4.11%
jan 1, 2011
318.565K
+57.127K
21.85%
jan 1, 2012
324.411K
+5.846K
1.84%
jan 1, 2013
323.731K
-680.0
-0.21%
jan 1, 2014
593.331K
+269.6K
83.28%
Ranking of countries by current statistics by years


Comments: